JetBlue Airways Corporation JBLU reported a fourth-quarter 2024 loss (excluding 8 cents from non-recurring items) of 21 cents per share, narrower than the Zacks Consensus Estimate of a loss of 30 cents. Lower operating costs aided the bottom line. In the year-ago quarter, JBLU reported a loss of 19 cents per share.
Find the latest EPS estimates and surprises on Zacks Earnings Calendar .
Operating revenues of $2.28 billion beat the Zacks Consensus Estimate of $2.26 billion but decreased 2.1% year over year. Passenger revenues, accounting for the bulk of the top line (92.1%), declined 3.1% year over year to $2.1 billion. The figure was in line with our estimate. Other revenues rose 11.5% year over year to $177 million, shy of our estimate of $181 million.
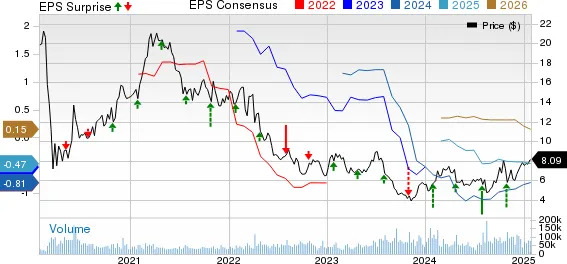
JetBlue Airways Corporation price-consensus-eps-surprise-chart | JetBlue Airways Corporation Quote
Other Details of JBLU’s Q4 Earnings
Revenue per available seat mile (RASM: a key measure of unit revenues) increased 3.2% year over year to 14.11 cents. Passenger revenue per available seat mile grew 2.2% year over year to 13.01 cents. The average fare at JetBlue inched down 0.3% year over year to $211.18. The yield per passenger mile rose 1.9% year over year.
Consolidated traffic (measured in revenue passenger miles) declined 2.6% year over year. Capacity (measured in available seat miles) dropped 5.1% year over year. Consolidated load factor (percentage of seats filled by passengers) improved 2.1 percentage points to 82.2% as the traffic decline was less than the capacity reduction. Our estimate for load factor is pegged at 80.6%.
Total operating costs (on a reported basis) declined 5.5% year over year to $2.26 billion. Expenses on salaries, wages and benefits increased 10.3% year over year. Expenses on aircraft fuel declined 27.3% year over year.
The average fuel price per gallon (including related taxes) was $2.47, down 22.3% year over year. JBLU’s operating expenses per available seat mile (CASM) decreased 0.4% year over year. Excluding fuel, CASM rose 11% to 10.76 cents.
JBLU’s Outlook
For first-quarter 2025, capacity is anticipated to decline in the 2-5% band. CASM, excluding fuel and special items, is predicted to climb 8-10%. Capital expenditures are expected to be roughly $270 million. RASM is forecasted to either decline 0.5% or increase 3.5% from first-quarter 2024 actuals. The average fuel cost per gallon is estimated to be between $2.65 and $2.8.
For 2025, capacity is envisioned to be flat year over year. CASM, excluding fuel and special items, is predicted to be up in the 5-7% range. RASM is expected to increase in the 3-6% band. Adjusted operating margin is expected in the 0-1% band. Capital expenditures are expected to be roughly $1.4 billion.
Currently, JBLU carries a Zacks Rank #3 (Hold). You can see the complete list of today’s Zacks #1 Rank (Strong Buy) stocks here .
Delta Air Lines DAL reported fourth-quarter 2024 earnings (excluding 56 cents from non-recurring items) of $1.85 per share, which surpassed the Zacks Consensus Estimate of $1.76. Earnings increased 44.5% on a year-over-year basis due to low fuel costs.
DAL’s revenues of $15.56 billion beat the Zacks Consensus Estimate of $14.99 billion and increased 9.4% on a year-over-year basis, driven by strong holiday travel demand. Adjusted operating revenues (excluding third-party refinery sales) totaled $14.44 billion, up 5.7% year over year. Passenger revenues, which accounted for 82.4% of total revenues, increased 5% year over year to $12.82 billion.
United Airlines UAL reported solid fourth-quarter 2024 results with both earnings and revenues surpassing the Zacks Consensus Estimate.
Quarterly earnings per share (excluding 31 cents from non-recurring items) of $3.26 surpassed the Zacks Consensus Estimate of $3.01. The bottom line increased 63% on a year-over-year basis. The reported figure exceeded the company’s guided range of $2.50-$3. UAL expects first-quarter 2025 earnings between 75 cents and $1.25 per share.
American Airlines’ AAL fourth-quarter 2024 earnings (excluding 2 cents from non-recurring items) of 86 cents per share beat the Zacks Consensus Estimate of 64 cents. In the year-ago quarter, AAL reported earnings of 29 cents per share. Operating revenues of $13.66 billion surpassed the Zacks Consensus Estimate of $13.42 billion and increased 4.6% year over year.
AAL expects a loss per share of 20-40 cents in the first quarter of 2025. It expects 2025 adjusted earnings per share to be $1.7-$2.7. For full-year 2025, TRASM is expected to be up in the 4.5-7.5% band from 2024 actuals.
Want the latest recommendations from Zacks Investment Research? Today, you can download 7 Best Stocks for the Next 30 Days. Click to get this free report
Delta Air Lines, Inc. (DAL) : Free Stock Analysis Report
United Airlines Holdings Inc (UAL) : Free Stock Analysis Report
JetBlue Airways Corporation (JBLU) : Free Stock Analysis Report
American Airlines Group Inc. (AAL) : Free Stock Analysis Report
To read this article on Zacks.com click here.
Zacks Investment Research