
Record Adjusted Net Revenue Grew 24% Driven by 52% Combined Growth in Financial Services and Tech Platform Segments, Representing 49% of Total Adjusted Net Revenue
34% Growth in Members and 32% Growth in Products in 2024 Remain Key Drivers of Growth
Record Fee Based Revenue of $289 Million Increased 63%, Reinforcing Strength of Increased Mix of Higher ROE Revenue
Management Announces 2025 Guidance
SAN FRANCISCO, January 27, 2025 --( BUSINESS WIRE )--SoFi Technologies, Inc. (NASDAQ: SOFI), a member-centric, one-stop shop for digital financial services that helps members borrow, save, spend, invest and protect their money, reported financial results today for its fourth quarter and fiscal year ended December 31, 2024.
"2024 was SoFi's best year ever," said Anthony Noto, CEO of SoFi Technologies, Inc.
"Our ability to deliver durable growth and strong returns throughout the year was once again the direct result of our relentless focus on innovation and brand building. SoFi set new records in revenue, profit, members, and products in 2024, and we look forward to continuing to build momentum on this in 2025."
Noto continued: "In the fourth quarter, our Financial Services and Tech Platform segments made up a record 49% of SoFi's adjusted net revenue, up from 40% in the year ago quarter. These businesses grew revenue by a combined 52% year-over-year, a testament to our continued execution and deliberate shift towards capital-light, higher ROE, cash, fee based revenue streams."
|
Consolidated Results Summary |
||||||||||||||||||||||
|
|
||||||||||||||||||||||
|
|
|
Three Months Ended December 31, |
|
% Change |
|
Year Ended December 31, |
|
% Change |
||||||||||||||
|
($ in thousands, except per share amounts) |
|
|
2024 |
|
|
|
2023 |
|
|
|
|
2024 |
|
|
|
2023 |
|
|
||||
|
Consolidated – GAAP |
|
|
|
|
|
|
|
|
|
|
|
|
||||||||||
|
Total net revenue |
|
$ |
734,125 |
|
$ |
615,404 |
|
19 |
% |
|
$ |
2,674,859 |
|
$ |
2,122,789 |
|
26 |
% |
||||
|
Net income (loss) |
|
|
332,473 |
|
|
|
47,913 |
|
|
594 |
% |
|
|
498,665 |
|
|
|
(300,742 |
) |
|
n/m |
|
|
Net income (loss) attributable to common stockholders – diluted |
|
|
332,473 |
|
|
|
24,615 |
|
|
n/m |
|
|
|
434,776 |
|
|
|
(341,167 |
) |
|
n/m |
|
|
Earnings (loss) per share attributable to common stockholders – diluted |
|
$ |
0.29 |
|
|
$ |
0.02 |
|
|
n/m |
|
|
$ |
0.39 |
|
|
$ |
(0.36 |
) |
|
n/m |
|
|
Consolidated – Non-GAAP (1) |
|
|
|
|
|
|
|
|
|
|
|
|
||||||||||
|
Adjusted net revenue |
|
$ |
739,112 |
|
|
$ |
594,245 |
|
|
24 |
% |
|
$ |
2,606,170 |
|
|
$ |
2,073,940 |
|
|
26 |
% |
|
Adjusted EBITDA |
|
|
197,957 |
|
|
|
181,204 |
|
|
9 |
% |
|
|
666,480 |
|
|
|
431,737 |
|
|
54 |
% |
|
Adjusted net income (loss) |
|
|
61,030 |
|
|
|
47,913 |
|
|
27 |
% |
|
|
227,222 |
|
|
|
(53,568 |
) |
|
n/m |
|
|
Adjusted net income (loss) attributable to common stockholders – diluted |
|
|
61,030 |
|
|
|
24,615 |
|
|
148 |
% |
|
|
163,333 |
|
|
|
(93,993 |
) |
|
n/m |
|
|
Adjusted earnings (loss) per share – diluted |
|
$ |
0.05 |
|
|
$ |
0.02 |
|
|
150 |
% |
|
$ |
0.15 |
|
|
$ |
(0.10 |
) |
|
n/m |
|
|
|
||||||||||||||||||||||
|
(1) |
|
For more information and reconciliations of these non-GAAP measures to the most comparable GAAP measures, see "Non-GAAP Financial Measures" and Table 2 to the "Financial Tables" herein. |
Product Highlights
SoFi is a financial services company that leverages technology to serve people and enterprises. SoFi's continuous investments in innovation and brand building yielded several milestones in the year, fueling significant member and product growth and paving the way for future growth.
Among the highlights:
Consolidated Results
SoFi reported a number of key financial achievements. For the fourth quarter of 2024, GAAP net revenue of $734.1 million increased 19% relative to the prior-year period's $615.4 million. Record adjusted net revenue of $739.1 million grew 24% from the corresponding prior-year period of $594.2 million. For the full-year of 2024, GAAP net revenue of $2.7 billion increased 26% relative to the prior-year period's $2.1 billion. Record adjusted net revenue of $2.6 billion grew 26% from the corresponding prior-year period of $2.1 billion.
For the fourth quarter of 2024, total fee based revenue of $289.5 million increased 63% year-over-year. For full year 2024, fee based revenue of $969.9 million increased 74% year-over-year. This was driven by strong performance across origination fees, Loan Platform Business, as well as interchange, brokerage and referrals.
SoFi reported its fifth consecutive quarter and first full year of GAAP profitability. For the fourth quarter, GAAP net income reached $332.5 million and diluted earnings per share reached $0.29. When adjusting for non-recurring benefits related to deferred taxes, adjusted net income reached $61.0 million and adjusted diluted earnings per share reached $0.05 in the quarter. For full year 2024, GAAP net income reached $498.7 million and diluted earnings per share reached $0.39. When adjusting for non-recurring benefits related to deferred taxes, adjusted net income reached $227.2 million and adjusted diluted earnings per share reached $0.15 in 2024.
Fourth quarter record adjusted EBITDA of $198.0 million increased 9% from the prior year period's $181.2 million. This represents an adjusted EBITDA margin of 27%. Full-year 2024 record adjusted EBITDA of $666.5 million increased 54% from the prior year's $431.7 million. This represents an adjusted EBITDA margin of 26%. All three segments achieved record contribution profit in 2024.
Permanent equity grew by $403.7 million during the quarter, ending at $6.5 billion and $5.96 of permanent equity per share. Tangible book value grew by $465.3 million during the quarter and $1.4 billion during the year, ending at $4.9 billion and $4.47 of tangible book value per share, up from $3.61 per share in the prior year period.
Net interest income of $470.2 million for the fourth quarter was up 21% year-over-year. This was driven by a 23% increase in average interest-earning assets and a 68 basis points decrease in cost of funds, mostly offset by a 62 basis points decrease in average yields year-over-year. Net interest income of $1.7 billion for full-year 2024 was up 36% year-over-year. This was driven by a 38% increase in average interest-earning assets, and a 17 basis points decrease in cost of funds, partially offset by a 7 basis points decrease in average yields year-over-year.
For the fourth quarter, net interest margin of 5.91% increased 34 basis points sequentially from 5.57%, and decreased 11 basis points year-over-year from 6.02%. For the full-year, net interest margin of 5.80% decreased 8 basis points year over year from 5.88%. In the fourth quarter and full-year 2024, the average rate on deposits was 193 and 217 basis points lower than that of warehouse facilities, respectively. This translates to approximately $500 million and $564 million of annual interest expense savings, respectively.
Member and Product Growth
Continued growth in both total members and products in the fourth quarter and full-year 2024, along with improving operating efficiency, reflects the benefits of our broad product suite and unique Financial Services Productivity Loop (FSPL) strategy.
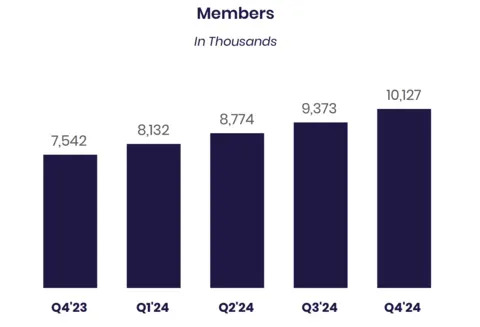
Record new member additions were 785 thousand in the fourth quarter of 2024, and total members reached over 10.1 million, up 34% from 7.5 million at the same prior year period.
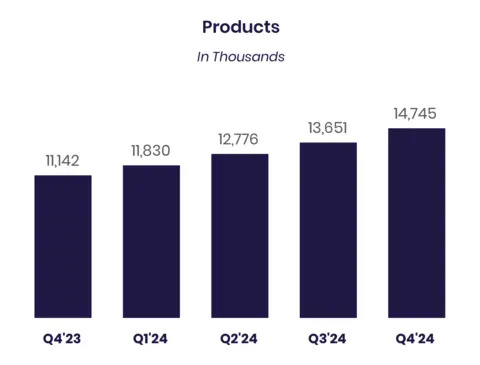
Record product additions were 1.1 million in the fourth quarter of 2024, and total products were over 14.7 million, up 32% from 11.1 million at the same prior year period.
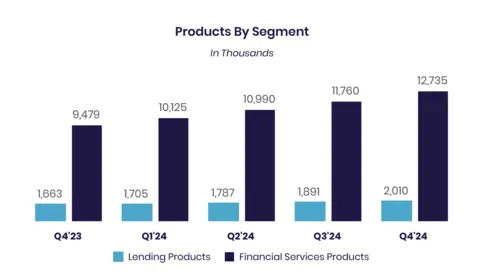
Financial Services products increased by 34% year-over-year to 12.7 million, primarily driven by continued demand for our SoFi Money, Relay and Invest products, and drove 90% of our total product growth.
Lending products increased by 21% year-over-year to 2.0 million products, driven primarily by continued demand for personal, student and home loan products.
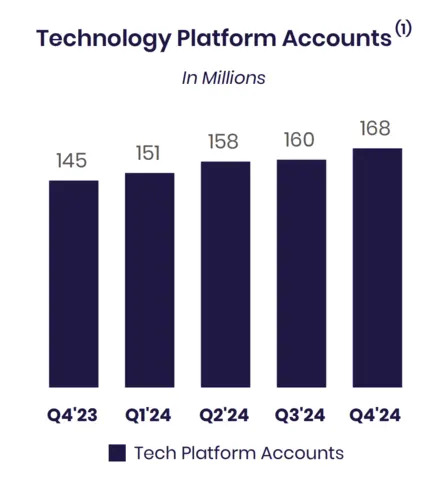
Technology Platform enabled accounts increased by 15% year-over-year to 168 million.
Financial Services Segment Results
For the fourth quarter of 2024, Financial Services segment net revenue of $256.5 million increased 84% from the prior year period. Net interest income of $160.3 million increased 47% year-over-year, primarily driven by growth in consumer deposits. Noninterest income of $96.2 million increased 220% year-over-year, which represents nearly $390 million in annualized revenue.
For the full-year ended 2024, Financial Services segment net revenue of $821.5 million increased 88% from the prior year period. Net interest income of $573.4 million increased 71% year-over-year, primarily driven by growth in consumer deposits. Noninterest income of $248.1 million increased 144% year-over-year.
In the fourth quarter, we generated $63.2 million in loan platform fees, driven by $1.1 billion of personal loans originated on behalf of third parties as well as referrals. Additionally, our Loan Platform Business generated $3.6 million in servicing cash flow which is recorded in our Lending segment. In total, our Loan Platform Business added $66.9 million to our consolidated adjusted net revenue across these two segments.
In addition to our Loan Platform Business, we continued to see healthy growth in interchange in the fourth quarter and full-year 2024, up 63% and 90% year-over-year, respectively, as a result of over $14 billion in total annualized spend in the quarter across Money and Credit Card.
Contribution profit for the fourth quarter of 2024 reached $114.9 million, a $89.8 million improvement from the prior year period, while contribution margin grew 27 percentage points year-over-year to 45%. Contribution profit for the full-year of 2024 reached $307.0 million, a $307.3 million improvement from the prior year period, while contribution margin improved significantly year-over-year to 37%.
|
Financial Services – Segment Results of Operations |
||||||||||||||||||||||
|
|
|
Three Months Ended December 31, |
|
|
|
Year Ended December 31, |
|
|
||||||||||||||
|
($ in thousands) |
|
|
2024 |
|
|
|
2023 |
|
|
% Change |
|
|
2024 |
|
|
|
2023 |
|
|
% Change |
||
|
Net interest income |
|
$ |
160,337 |
|
|
$ |
109,072 |
|
|
47 |
% |
|
$ |
573,422 |
|
|
$ |
334,847 |
|
|
71 |
% |
|
Noninterest income |
|
|
96,183 |
|
|
|
30,043 |
|
|
220 |
% |
|
|
248,089 |
|
|
|
101,668 |
|
|
144 |
% |
|
Total net revenue – Financial Services |
|
|
256,520 |
|
|
|
139,115 |
|
|
84 |
% |
|
|
821,511 |
|
|
|
436,515 |
|
|
88 |
% |
|
Provision for credit losses (1) |
|
|
(6,852 |
) |
|
|
(12,092 |
) |
|
(43 |
)% |
|
|
(31,659 |
) |
|
|
(54,945 |
) |
|
(42 |
)% |
|
Directly attributable expenses (1) |
|
|
(134,813 |
) |
|
|
(101,963 |
) |
|
32 |
% |
|
|
(482,845 |
) |
|
|
(381,832 |
) |
|
26 |
% |
|
Contribution profit – Financial Services |
|
$ |
114,855 |
|
|
$ |
25,060 |
|
|
358 |
% |
|
$ |
307,007 |
|
|
$ |
(262 |
) |
|
n/m |
|
|
Contribution margin – Financial Services (2) |
|
|
45 |
% |
|
|
18 |
% |
|
|
|
|
37 |
% |
|
|
— |
% |
|
|
||
|
|
||||||||||||||||||||||
|
(1) |
|
In the fourth quarter of 2024, we made a presentation change to present the provision for credit losses below total net revenue and above directly attributable expenses , from its previous presentation within directly attributable expenses . Respective prior period amounts were recast to conform to the current period presentation. |
|
(2) |
|
Contribution margin is defined for each of our reportable segments as contribution profit (loss), divided by net revenue. |
By continuously innovating with new and relevant offerings, features and rewards for members, SoFi grew total Financial Services products by 3.3 million, or 34%, year-over-year, bringing the total to 12.7 million at quarter-end. SoFi Money reached 5.1 million products, Relay reached 4.6 million products and SoFi Invest reached 2.5 million products by the end of the fourth quarter.
Monetization continues to improve across all products, with annualized revenue per product of $81 and $65 during the fourth quarter and full-year of 2024, up 37% and 40% year-over-year, respectively.
SoFi Money continues to offer a top tier APY of up to 3.8% as of January 27, 2025, no minimum balance requirement nor balance limits, FDIC insurance through a network of participating banks of up to $2 million, a host of free features and a unique rewards program.
Total deposits grew to $26.0 billion, with over 90% of SoFi Money deposits (inclusive of Checking and Savings and cash management accounts) coming from direct deposit members, with more than half of newly funded SoFi Money accounts setting up direct deposit by day 30.
|
Financial Services – Products |
|
December 31, |
|
|
|||||||
|
|
|
|
2024 |
|
|
|
2023 |
|
|
% Change |
|
|
Money (1) |
|
5,094,785 |
|
3,374,310 |
|
51 |
% |
||||
|
Invest (2) |
|
|
2,525,059 |
|
|
|
2,380,641 |
|
|
6 |
% |
|
Credit Card |
|
|
279,360 |
|
|
|
245,385 |
|
|
14 |
% |
|
Referred loans (3) |
|
|
85,205 |
|
|
|
55,231 |
|
|
54 |
% |
|
Relay |
|
|
4,636,755 |
|
|
|
3,336,868 |
|
|
39 |
% |
|
At Work |
|
|
113,917 |
|
|
|
87,035 |
|
|
31 |
% |
|
Total financial services products (2) |
|
|
12,735,081 |
|
|
|
9,479,470 |
|
|
34 |
% |
|
|
|||||||||||
|
(1) |
|
Includes checking and savings accounts held at SoFi Bank, and cash management accounts. |
|
(2) |
|
Year-over-year product growth for Invest and total financial services products was 19% and 38%, respectively, when excluding digital assets accounts related to our transfer of crypto services in 2023. |
|
(3) |
|
Limited to loans wherein we provide third party fulfillment services as part of our Loan Platform Business. |
Technology Platform Segment Results
Technology Platform segment net revenue of $102.8 million for the fourth quarter of 2024 increased 6% year-over-year. Contribution profit of $32.1 million increased 5% from the prior year period, for a contribution margin of 31%.
For the full year 2024, net revenue of $395.2 million increased 12% year-over-year. Contribution profit of $127.0 million increased 34% from the prior year period, for a contribution margin of 32%.
We have continued to demonstrate our ability to serve a broad range of clients, including governmental agencies, fintechs, and consumer brands. Notable deals include:
Galileo was recently selected by the US Department of the Treasury as the processing partner for Direct Express, a prepaid debit card program that 3.4 million people use to access their federal benefits. This is a testament to our Tech Platform’s differentiated offering, as well as its strength and reliability. We are excited about the integration that will take place in 2025 and the financial impact that we will see in 2026.
We signed a large US-based financial services provider that offers short-term consumer loans, card services, check cashing, and other financial products. They have a large, loyal, and highly active debit card portfolio and will rely on our technology to power existing and new capabilities. Once they fully transition to our platform in early 2026, they will be a top 10 client on a revenue basis.
We have signed a leading hotel rewards brand for our new co-branded card program launching in the first half of 2025. This is a new, differentiated offering that will expand our footprint among consumer brands.
These deals represent more predictable revenue from larger established brands, with notably higher average deal sizes. The implementation and the integration cycles will be gradual and the revenue impacts will most likely be in 2026.
|
Technology Platform – Segment Results of Operations |
||||||||||||||||||||||
|
|
|
Three Months Ended December 31, |
|
|
|
Year Ended December 31, |
|
|
||||||||||||||
|
($ in thousands) |
|
|
2024 |
|
|
|
2023 |
|
|
% Change |
|
|
2024 |
|
|
|
2023 |
|
|
% Change |
||
|
Net interest income |
|
$ |
473 |
|
|
$ |
941 |
|
|
(50 |
)% |
|
$ |
2,158 |
|
|
$ |
1,514 |
|
|
43 |
% |
|
Noninterest income |
|
|
102,362 |
|
|
|
95,966 |
|
|
7 |
% |
|
|
393,020 |
|
|
|
350,826 |
|
|
12 |
% |
|
Total net revenue – Technology Platform |
|
|
102,835 |
|
|
|
96,907 |
|
|
6 |
% |
|
|
395,178 |
|
|
|
352,340 |
|
|
12 |
% |
|
Directly attributable expenses |
|
|
(70,728 |
) |
|
|
(66,323 |
) |
|
7 |
% |
|
|
(268,223 |
) |
|
|
(257,554 |
) |
|
4 |
% |
|
Contribution profit |
|
$ |
32,107 |
|
|
$ |
30,584 |
|
|
5 |
% |
|
$ |
126,955 |
|
|
$ |
94,786 |
|
|
34 |
% |
|
Contribution margin – Technology Platform (1) |
|
|
31 |
% |
|
|
32 |
% |
|
|
|
|
32 |
% |
|
|
27 |
% |
|
|
||
|
|
||||||||||||||||||||||
|
(1) |
|
Contribution margin is defined for each of our reportable segments as contribution profit (loss), divided by net revenue. |
Technology Platform total enabled client accounts increased 15% year-over-year, to 167.7 million up from 145.4 million in the prior-year period.
|
Technology Platform |
|
December 31, |
|
|
|||||||
|
|
|
|
2024 |
|
|
|
2023 |
|
|
% Change |
|
|
Total accounts |
|
167,713,818 |
|
145,425,391 |
|
15 |
% |
||||
Lending Segment Results
For the fourth quarter of 2024, Lending segment GAAP net revenue of $417.8 million increased 18% from the prior year period, while adjusted net revenue for the segment of $422.8 million increased 22% from the prior year period. For the full-year ended 2024, Lending segment GAAP net revenue of $1.5 billion increased 8% from the prior year period, while adjusted net revenue for the segment of $1.5 billion increased 11% from the prior year period.
Lending segment performance in the fourth quarter was driven by net interest income, which rose 31% year-over-year and now makes up 82% of segment adjusted net revenue. This was driven by a 23% year-over-year increase in average interest-earning assets and a 68 basis points decrease in cost of funds, mostly offset by a 62 basis points decrease year-over-year in average yields. For the full-year ended 2024, performance was also driven by net interest income, which rose 26% year-over-year. This was driven by a 38% year-over-year increase in average interest-earning assets and an 17 basis points decrease in cost of funds, partially offset by a 7 basis points decrease year-over-year in average yields.
Lending segment fourth quarter contribution profit of $246.0 million was up 9% from $226.1 million in the corresponding prior-year period. Lending segment adjusted contribution margin decreased to 58% from 65% in the prior year period. Full-year 2024 contribution profit of $890.5 million was up 8% from $823.3 million in the corresponding prior-year period. Lending segment adjusted contribution margin decreased to 60% from 62% in the corresponding prior-year period. These strong margins reflect SoFi’s ability to capitalize on continued strong demand for its lending products.
|
Lending – Segment Results of Operations |
||||||||||||||||||||||
|
|
|
Three Months Ended December 31, |
|
|
|
Year Ended December 31, |
|
|
||||||||||||||
|
($ in thousands) |
|
|
2024 |
|
|
|
2023 |
|
|
% Change |
|
|
2024 |
|
|
|
2023 |
|
|
% Change |
||
|
Net interest income |
|
$ |
345,210 |
|
|
$ |
262,626 |
|
|
31 |
% |
|
$ |
1,207,226 |
|
|
$ |
960,773 |
|
|
26 |
% |
|
Noninterest income |
|
|
72,586 |
|
|
|
90,500 |
|
|
(20 |
)% |
|
|
277,996 |
|
|
|
409,848 |
|
|
(32 |
)% |
|
Total net revenue – Lending |
|
|
417,796 |
|
|
|
353,126 |
|
|
18 |
% |
|
|
1,485,222 |
|
|
|
1,370,621 |
|
|
8 |
% |
|
Servicing rights – change in valuation inputs or assumptions |
|
|
4,962 |
|
|
|
(6,595 |
) |
|
n/m |
|
|
|
(6,280 |
) |
|
|
(34,700 |
) |
|
(82 |
)% |
|
Residual interests classified as debt – change in valuation inputs or assumptions |
|
|
25 |
|
|
|
10 |
|
|
150 |
% |
|
|
108 |
|
|
|
425 |
|
|
(75 |
)% |
|
Directly attributable expenses |
|
|
(176,825 |
) |
|
|
(120,431 |
) |
|
47 |
% |
|
|
(588,507 |
) |
|
|
(513,073 |
) |
|
15 |
% |
|
Contribution profit – Lending |
|
$ |
245,958 |
|
|
$ |
226,110 |
|
|
9 |
% |
|
$ |
890,543 |
|
|
$ |
823,273 |
|
|
8 |
% |
|
Contribution margin – Lending (1) |
|
|
59 |
% |
|
|
64 |
% |
|
|
|
|
60 |
% |
|
|
60 |
% |
|
|
||
|
|
|
|
|
|
|
|
|
|
|
|
|
|
||||||||||
|
Adjusted net revenue – Lending (non-GAAP) (2) |
|
$ |
422,783 |
|
|
$ |
346,541 |
|
|
22 |
% |
|
$ |
1,479,050 |
|
|
$ |
1,336,346 |
|
|
11 |
% |
|
Adjusted contribution margin – Lending (non-GAAP) (2) |
|
|
58 |
% |
|
|
65 |
% |
|
|
|
|
60 |
% |
|
|
62 |
% |
|
|
||
|
|
||||||||||||||||||||||
|
(1) |
|
Contribution margin is defined for each of our reportable segments as contribution profit (loss), divided by net revenue. |
|
(2) |
|
For more information and a reconciliation of these non-GAAP financial measures to the most comparable GAAP measure, see "Non-GAAP Financial Measures" and Table 2 to the "Financial Tables" herein. |
|
|
|
Lending – Loans At Fair Value |
|||||||||||||||
|
|
|||||||||||||||
|
($ in thousands) |
Personal Loans |
|
Student Loans |
|
Home Loans |
|
Total |
||||||||
|
December 31, 2024 |
|
|
|
|
|
|
|
||||||||
|
Unpaid principal |
$ |
16,589,623 |
|
$ |
8,215,629 |
|
$ |
149,862 |
|
$ |
24,955,114 |
||||
|
Accumulated interest |
|
128,733 |
|
|
|
44,603 |
|
|
|
260 |
|
|
|
173,596 |
|
|
Cumulative fair value adjustments (1) |
|
814,040 |
|
|
|
337,136 |
|
|
|
2,374 |
|
|
|
1,153,550 |
|
|
Total fair value of loans (2)(3) |
$ |
17,532,396 |
|
|
$ |
8,597,368 |
|
|
$ |
152,496 |
|
|
$ |
26,282,260 |
|
|
September 30, 2024 |
|
|
|
|
|
|
|
||||||||
|
Unpaid principal |
$ |
16,199,604 |
|
|
$ |
7,437,305 |
|
|
$ |
80,115 |
|
|
$ |
23,717,024 |
|
|
Accumulated interest |
|
118,169 |
|
|
|
34,956 |
|
|
|
42 |
|
|
|
153,167 |
|
|
Cumulative fair value adjustments (1) |
|
925,051 |
|
|
|
404,406 |
|
|
|
1,533 |
|
|
|
1,330,990 |
|
|
Total fair value of loans (2)(3) |
$ |
17,242,824 |
|
|
$ |
7,876,667 |
|
|
$ |
81,690 |
|
|
$ |
25,201,181 |
|
|
|
|||||||||||||||
|
(1) |
|
During the three months ended December 31, 2024, the cumulative fair value adjustments for personal loans were primarily impacted by higher unpaid principal balance, higher discount rate and lower weighted average coupon. The higher discount rate was driven by a 63 basis points increase in benchmark rates partially offset by 12 basis points of spread tightening. The cumulative fair value adjustments for student loans were primarily impacted by higher unpaid principal balance, higher discount rate and higher prepayment rate. The higher discount rate was driven by a 76 basis points increase in benchmark rates partially offset by 35 basis points of spread tightening. |
|
(2) |
|
Each component of the fair value of loans is impacted by charge-offs during the period. Our fair value assumption for annual default rate incorporates fair value markdowns on loans beginning when they are 10 days or more delinquent, with additional markdowns at 30, 60 and 90 days past due. |
|
(3) |
|
Student loans are classified as loans held for investment, and personal loans and home loans are classified as loans held for sale. |
The following table summarizes the significant inputs to the fair value model for personal and student loans:
|
|
Personal Loans |
|
Student Loans |
||||||||
|
|
December 31, 2024 |
|
September 30, 2 024 |
|
December 31, 2024 |
|
September 30, 2 024 |
||||
|
Weighted average coupon rate (1) |
13.4 |
% |
|
13.5 |
% |
|
5.9 |
% |
|
5.9 |
% |
|
Weighted average annual default rate |
4.5 |
% |
|
4.5 |
% |
|
0.7 |
% |
|
0.7 |
% |
|
Weighted average conditional prepayment rate |
26.0 |
% |
|
26.1 |
% |
|
11.0 |
% |
|
10.7 |
% |
|
Weighted average discount rate |
5.29 |
% |
|
4.78 |
% |
|
4.40 |
% |
|
3.99 |
% |
|
Benchmark rate (2) |
4.1 |
% |
|
3.4 |
% |
|
4.0 |
% |
|
3.3 |
% |
|
|
|||||||||||
|
(1) |
|
Represents the average coupon rate on loans held on balance sheet, weighted by unpaid principal balance outstanding at the balance sheet date. |
|
(2) |
|
Corresponds with two-year SOFR for personal loans, and four-year SOFR for student loans. |
For the fourth quarter of 2024, record origination volume of $7.2 billion increased 66% year-over-year. For the full year 2024, record origination volume of $23.2 billion increased 33% year-over-year. This was a result of continued strong demand for personal loan, student loan and home loan originations.
Personal loan record originations of $5.3 billion in the fourth quarter of 2024 were up 63% year-over-year, inclusive of $1.1 billion originated on behalf of third parties for our Loan Platform Business. Fourth quarter student loan volume of $1.3 billion was up 71% year-over-year, representing the best quarter since the end of 2021. Fourth quarter home loan volume of $577 million was up 87% year-over-year, also representing the best quarter of originations since 2021.
The fourth quarter of 2024 represented our best quarter of capital markets transactions since going public. Overall, we sold, or transferred through our Loan Platform Business, more than $3.4 billion in total of personal loans, home loans and senior secured loans.
We continued to improve credit performance in the fourth quarter, with on-balance sheet 90 day personal loan delinquency rate of 55 basis points, a decrease from 57 basis points in the prior quarter.
Personal loan annualized charge-off rate decreased to 3.37% from 3.52% in the prior quarter, including the impact of asset sales, new originations and the delinquency sales in the quarter. Had we not sold these late stage delinquencies, we estimate that, including recoveries, would have had an all-in annualized net charge off rate for personal loans of approximately 4.9% vs. 5.0% last quarter.
The data continues to support our 7–8% maximum life of loan loss assumptions for personal loans, in line with our underwriting tolerance, although we continue to trend below these levels.
Our recent vintages, originated from Q4 2022 to Q1 2024 have net cumulative losses of 3.8%, with 45% unpaid principal balance remaining. This is well below the 5.25% observed at the same point in time for the 2017 vintage – that last vintage that approached our 7–8% tolerance. Similar to last quarter, the gap between the newer cohort curve and the 2017 cohort curve widened by 15 basis points, demonstrating continued improvement.
Additionally, looking at our Q1 2020 through Q3 2024 originations, 58% of principal has already been paid down, with 6.5% in net cumulative losses. Therefore, for life-of-loan losses on this entire cohort of loans to reach 8%, the charge-off at a rate on the remaining 42% of unpaid principal would need to exceed 10%. This would be well above past levels, further underscoring our confidence in achieving loss rates below 8% tolerance.
|
Lending – Originations and Average Balances |
||||||||||||||||||||||
|
|
|
Three Months Ended December 31, |
|
% Change |
|
Year Ended December 31, |
|
% Change |
||||||||||||||
|
|
|
|
2024 |
|
|
|
2023 |
|
|
|
|
2024 |
|
|
|
2023 |
|
|
||||
|
Origination volume ($ in thousands, during period) |
|
|
|
|
|
|
|
|
|
|
|
|
||||||||||
|
Personal loans (1) |
|
$ |
5,251,949 |
|
$ |
3,222,759 |
|
63 |
% |
|
$ |
17,614,985 |
|
$ |
13,801,065 |
|
28 |
% |
||||
|
Student loans |
|
|
1,348,970 |
|
|
|
789,970 |
|
|
71 |
% |
|
|
3,780,752 |
|
|
|
2,630,040 |
|
|
44 |
% |
|
Home loans |
|
|
577,362 |
|
|
|
308,884 |
|
|
87 |
% |
|
|
1,820,213 |
|
|
|
997,492 |
|
|
82 |
% |
|
Total |
|
$ |
7,178,281 |
|
|
$ |
4,321,613 |
|
|
66 |
% |
|
$ |
23,215,950 |
|
|
$ |
17,428,597 |
|
|
33 |
% |
|
Average loan balance ($, as of period end) (2) |
|
|
|
|
|
|
|
|
|
|
|
|
||||||||||
|
Personal loans |
|
$ |
25,377 |
|
|
$ |
24,223 |
|
|
5 |
% |
|
|
|
|
|
|
|||||
|
Student loans |
|
|
42,960 |
|
|
|
44,683 |
|
|
(4 |
)% |
|
|
|
|
|
|
|||||
|
Home loans |
|
|
279,321 |
|
|
|
284,289 |
|
|
(2 |
)% |
|
|
|
|
|
|
|||||
|
|
||||||||||||||||||||||
|
(1) |
|
Inclusive of origination volume related to our Loan Platform Business. |
|
(2) |
|
Within each loan product category, average loan balance is defined as the total unpaid principal balance of the loans divided by the number of loans that have a balance greater than zero dollars as of the reporting date. Average loan balance includes loans on our balance sheet, as well as transferred loans and referred loans with which we have a continuing involvement through our servicing agreements. |
|
|
|
Lending – Products |
|
December 31, |
|
|
|||||||
|
|
|
|
2024 |
|
|
|
2023 |
|
|
% Change |
|
|
Personal loans (1) |
|
1,405,928 |
|
1,113,864 |
|
26 |
% |
||||
|
Student loans |
|
|
568,612 |
|
|
|
519,489 |
|
|
9 |
% |
|
Home loans |
|
|
35,814 |
|
|
|
29,653 |
|
|
21 |
% |
|
Total lending products |
|
|
2,010,354 |
|
|
|
1,663,006 |
|
|
21 |
% |
|
(1) |
|
Includes loans which we originate as part of our Loan Platform Business. |
Guidance and Outlook
Looking forward to 2025, after a year of bolstering the capital base, reaching GAAP profitability, as well as the scale required to drive continued profitability, management wants to better tilt the incremental revenue growth toward investment.
In 2025, management plans to manage towards an incremental EBITDA margin of approximately 30%, as the company re-invests in the business to continue to drive durable growth and strong returns well into the future.
In line with market expectations, the macro assumptions that underpin our financial guide include:
In the first quarter of 2025, management expects to generate $725 to $745 million of adjusted net revenue, $175 to $185 million of adjusted EBITDA, $30 to $40 million of GAAP net income and $0.03 of GAAP EPS.
For the full year 2025, management expects to deliver adjusted net revenue of $3.200 to $3.275 billion, which equates to approximately 23 to 26% year-over-year growth. Management expects adjusted EBITDA of $845 to $865 million, which equates to an incremental EBITDA margin of 30%, in line with our long term investment philosophy. We expect GAAP net income of $285 to $305 million, with an incremental margin of 20% when excluding 2024 non-recurring income tax benefits and gains on convertible notes. Lastly, we expect GAAP EPS of $0.25 to $0.27 cents per share. This guidance assumes a tax rate of 26%, which we currently believe to be our effective tax rate in 2025.
Management expects growth in tangible book value of approximately $550 to $575 million and expects to maintain a total capital ratio north of 15%.
Management expects to add at least 2.8 million new members in 2025, which represents 28% growth from 2024 levels.
Management will further address full-year guidance on the quarterly earnings conference call. Management has not reconciled forward-looking non-GAAP measures to their most directly comparable GAAP measures. This is because the company cannot predict with reasonable certainty and without unreasonable efforts the ultimate outcome of certain GAAP components of such reconciliations due to market-related assumptions that are not within our control as well as certain legal or advisory costs, tax costs or other costs that may arise. For these reasons, management is unable to assess the probable significance of the unavailable information, which could materially impact the amount of the future directly comparable GAAP measures.
Earnings Webcast
SoFi’s executive management team will host a live audio webcast beginning at 8:00 a.m. Eastern Time (5:00 a.m. Pacific Time) today to discuss the quarter’s financial results and business highlights. All interested parties are invited to listen to the live webcast at https://investors.sofi.com . A replay of the webcast will be available on the SoFi Investor Relations website for 30 days. Investor information, including supplemental financial information, is available on SoFi’s Investor Relations website at https://investors.sofi.com .
Cautionary Statement Regarding Forward-Looking Statements
Certain of the statements above are forward-looking and as such are not historical facts. This includes, without limitation, statements regarding our expectations for first quarter of 2025 and full year 2025 adjusted net revenue, adjusted EBITDA, adjusted EBITDA margin, GAAP net income, GAAP EPS, year end total capital ratio, member growth, and expected growth in tangible book value, our expectations regarding our ability to increase capital-light, higher ROE, fee-based revenue streams, our expectations regarding our ability to continue to grow our business, build our brand and launch new business lines and products, our ability to continue to attract and execute deals, our ability to continue to improve our financials and increase our member, product and total accounts count, our ability to achieve diversified and more durable growth, our ability to continue the momentum seen in 2024 in 2025, our ability to have loss rates below 8%, our ability to navigate the macroeconomic environment, any changes in demand for our products, and the financial position, business strategy and plans and objectives of management for our future operations. These forward-looking statements are not guarantees of performance. Such statements can be identified by the fact that they do not relate strictly to historical or current facts. Words such as "achieve", "believe", "continue", "expect", "future", "growth", "may", "plan", "strategy", "will be", "will continue", and similar expressions may identify forward-looking statements, but the absence of these words does not mean that a statement is not forward-looking. Factors that could cause actual results to differ materially from those contemplated by these forward-looking statements include: (i) the effect of and our ability to respond and adapt to changing market and economic conditions, including economic downturns, fluctuating inflation and interest rates, and volatility from global events; (ii) our ability to maintain net income profitability, continue to increase capital-light, higher ROE, fee-based revenue streams, continue to grow across our segments in the future, as well as our ability to meet our guidance; (iii) the impact on our business of the regulatory environment, changes in governmental policies, and complexities with compliance related to such environment; (iv) our ability to realize the benefits of being a bank holding company and operating SoFi Bank, including continuing to grow high quality deposits and our rewards program for members; (v) our ability to continue to drive brand awareness and realize the benefits of our marketing and advertising campaigns; (vi) our ability to vertically integrate our businesses and accelerate the pace of innovation of our financial products; (vii) our ability to manage our growth effectively and our expectations regarding the development and expansion of our business; (viii) our ability to access sources of capital on acceptable terms or at all; (ix) the success of our continued investments in our Financial Services segment and in our business generally; (x) our ability to expand our member base and increase our product adds; (xi) our ability to maintain our leadership position in certain categories of our business and to grow market share in existing markets or any new markets we may enter; (xii) our ability to cater to a broad range of clients and continue to execute deals with current or future business partners; (xiii) our ability to develop new products, features and functionality that are competitive and meet market needs; (xiv) our ability to realize the benefits of our strategy, including what we refer to as our FSPL; (xv) our ability to make accurate credit and pricing decisions or effectively forecast our loss rates; (xvi) our ability to establish and maintain an effective system of internal controls over financial reporting; (xvii) our ability to maintain the security and reliability of our products; and (xviii) the outcome of any legal or governmental proceedings instituted against us. The foregoing list of factors is not exhaustive. You should carefully consider the foregoing factors and the other risks and uncertainties set forth in the section titled "Risk Factors" in our last quarterly report on Form 10-Q, as filed with the Securities and Exchange Commission, and those that are included in any of our future filings with the Securities and Exchange Commission, including our annual report on Form 10-K, under the Exchange Act. These forward-looking statements are based on information available as of the date hereof and current expectations, forecasts and assumptions, and involve a number of judgments, risks and uncertainties. Accordingly, forward-looking statements should not be relied upon as representing our views as of any subsequent date, and we do not undertake any obligation to update forward-looking statements to reflect events or circumstances after the date they were made, whether as a result of new information, future events or otherwise, except as may be required under applicable securities laws.
As a result of a number of known and unknown risks and uncertainties, our actual results or performance may be materially different from those expressed or implied by these forward-looking statements. You should not place undue reliance on these forward-looking statements.
Non-GAAP Financial Measures
This press release presents information about certain non-GAAP financial measures provided as supplements to the results provided in accordance with accounting principles generally accepted in the United States (GAAP). Our management and Board of Directors uses these non-GAAP measures to evaluate our operating performance, formulate business plans, help better assess our overall liquidity position, and make strategic decisions, including those relating to operating expenses and the allocation of internal resources. Accordingly, we believe that these non-GAAP measures provide useful information to investors and others in understanding and evaluating our operating results in the same manner as our management and Board of Directors. These non-GAAP measures have limitations as analytical tools, and should not be considered in isolation from, or as a substitute for, the analysis of other GAAP financial measures. Other companies may not use these non-GAAP measures or may use similar measures that are defined in a different manner. Therefore, SoFi's non-GAAP measures may not be directly comparable to similarly titled measures of other companies.
Reconciliations of these non-GAAP measures to the most directly comparable GAAP financial measures are provided in Table 2 to the "Financial Tables" herein.
About SoFi
SoFi (NASDAQ: SOFI) is a member-centric, one-stop shop for digital financial services on a mission to help people achieve financial independence to realize their ambitions. The company’s full suite of financial products and services helps its over 10.1 million SoFi members borrow, save, spend, invest, and protect their money better by giving them fast access to the tools they need to get their money right, all in one app. SoFi also equips members with the resources they need to get ahead – like credentialed financial planners, exclusive experiences and events, and a thriving community – on their path to financial independence.
SoFi innovates across three business segments: Lending, Financial Services – which includes SoFi Checking and Savings, SoFi Invest, SoFi Credit Card, SoFi Protect, and SoFi Insights – and Technology Platform, which offers the only end-to-end vertically integrated financial technology stack. SoFi Bank, N.A., an affiliate of SoFi, is a nationally chartered bank, regulated by the OCC and FDIC and SoFi is a bank holding company regulated by the Federal Reserve. The company is also the naming rights partner of SoFi Stadium, home of the Los Angeles Chargers and the Los Angeles Rams. For more information, visit https://www.sofi.com or download our iOS and Android apps.
Availability of Other Information About SoFi
Investors and others should note that we communicate with our investors and the public using our website ( https://www.sofi.com ), the investor relations website ( https://investors.sofi.com ), and on social media (X and LinkedIn), including but not limited to investor presentations and investor fact sheets, Securities and Exchange Commission filings, press releases, public conference calls and webcasts. The information that SoFi posts on these channels and websites could be deemed to be material information. As a result, SoFi encourages investors, the media, and others interested in SoFi to review the information that is posted on these channels, including the investor relations website, on a regular basis. This list of channels may be updated from time to time on SoFi’s investor relations website and may include additional social media channels. The contents of SoFi’s website or these channels, or any other website that may be accessed from its website or these channels, shall not be deemed incorporated by reference in any filing under the Securities Act of 1933, as amended.
SOFI-F
FINANCIAL TABLES
(Unaudited)
Condensed Consolidated Statements of Operations and Comprehensive Income (Loss)
Reconciliation of GAAP to Non-GAAP Financial Measures
Condensed Consolidated Balance Sheets
Average Balances and Net Interest Earnings Analysis
Condensed Consolidated Cash Flow Data
Company Metrics
Segment Financials
Disaggregated Revenue
Analysis of Charge-Offs
Regulatory Capital
|
Table 1 |
|||||||||||||||
|
|
|||||||||||||||
|
SoFi Technologies, Inc. Condensed Consolidated Statements of Operations and Comprehensive Income (Loss) (Unaudited) (In Thousands, Except for Per Share Data) |
|||||||||||||||
|
|
|||||||||||||||
|
|
Three Months Ended December 31, |
|
Year Ended December 31, |
||||||||||||
|
|
|
2024 |
|
|
|
2023 |
|
|
|
2024 |
|
|
|
2023 |
|
|
Interest income |
|
|
|
|
|
|
|
||||||||
|
Loans and securitizations |
$ |
688,723 |
|
$ |
598,959 |
|
$ |
2,601,988 |
|
$ |
1,944,128 |
||||
|
Other |
|
55,214 |
|
|
|
46,278 |
|
|
|
205,829 |
|
|
|
106,939 |
|
|
Total interest income |
|
743,937 |
|
|
|
645,237 |
|
|
|
2,807,817 |
|
|
|
2,051,067 |
|
|
Interest expense |
|
|
|
|
|
|
|
||||||||
|
Securitizations and warehouses |
|
23,022 |
|
|
|
62,989 |
|
|
|
112,398 |
|
|
|
244,220 |
|
|
Deposits |
|
238,596 |
|
|
|
182,612 |
|
|
|
930,154 |
|
|
|
507,820 |
|
|
Corporate borrowings |
|
12,039 |
|
|
|
9,882 |
|
|
|
48,346 |
|
|
|
36,833 |
|
|
Other |
|
111 |
|
|
|
113 |
|
|
|
438 |
|
|
|
454 |
|
|
Total interest expense |
|
273,768 |
|
|
|
255,596 |
|
|
|
1,091,336 |
|
|
|
789,327 |
|
|
Net interest income |
|
470,169 |
|
|
|
389,641 |
|
|
|
1,716,481 |
|
|
|
1,261,740 |
|
|
Noninterest income |
|
|
|
|
|
|
|
||||||||
|
Loan origination, sales, and securitizations |
|
73,913 |
|
|
|
82,929 |
|
|
|
255,870 |
|
|
|
371,812 |
|
|
Servicing |
|
(1,316 |
) |
|
|
7,525 |
|
|
|
22,244 |
|
|
|
37,328 |
|
|
Technology products and solutions |
|
88,376 |
|
|
|
87,026 |
|
|
|
350,810 |
|
|
|
323,972 |
|
|
Loan platform fees |
|
63,235 |
|
|
|
9,341 |
|
|
|
141,608 |
|
|
|
33,602 |
|
|
Other |
|
39,748 |
|
|
|
38,942 |
|
|
|
187,846 |
|
|
|
94,335 |
|
|
Total noninterest income |
|
263,956 |
|
|
|
225,763 |
|
|
|
958,378 |
|
|
|
861,049 |
|
|
Total net revenue |
|
734,125 |
|
|
|
615,404 |
|
|
|
2,674,859 |
|
|
|
2,122,789 |
|
|
Provision for credit losses (1) |
|
6,877 |
|
|
|
12,092 |
|
|
|
31,712 |
|
|
|
54,945 |
|
|
Noninterest expense |
|
|
|
|
|
|
|
||||||||
|
Technology and product development |
|
148,986 |
|
|
|
141,817 |
|
|
|
551,787 |
|
|
|
511,419 |
|
|
Sales and marketing |
|
229,261 |
|
|
|
174,705 |
|
|
|
796,293 |
|
|
|
719,400 |
|
|
Cost of operations |
|
128,155 |
|
|
|
103,947 |
|
|
|
461,633 |
|
|
|
379,998 |
|
|
General and administrative |
|
160,922 |
|
|
|
131,685 |
|
|
|
600,089 |
|
|
|
511,011 |
|
|
Goodwill impairment |
|
— |
|
|
|
— |
|
|
|
— |
|
|
|
247,174 |
|
|
Total noninterest expense (1) |
|
667,324 |
|
|
|
552,154 |
|
|
|
2,409,802 |
|
|
|
2,369,002 |
|
|
Income (loss) before income taxes |
|
59,924 |
|
|
|
51,158 |
|
|
|
233,345 |
|
|
|
(301,158 |
) |
|
Income tax benefit (expense) |
|
272,549 |
|
|
|
(3,245 |
) |
|
|
265,320 |
|
|
|
416 |
|
|
Net income (loss) |
$ |
332,473 |
|
|
$ |
47,913 |
|
|
$ |
498,665 |
|
|
$ |
(300,742 |
) |
|
|
|
|
|
|
|
|
|
||||||||
|
Earnings (loss) per share |
|
|
|
|
|
|
|
||||||||
|
Earnings (loss) per share – basic |
$ |
0.31 |
|
|
$ |
0.04 |
|
|
$ |
0.46 |
|
|
$ |
(0.36 |
) |
|
Earnings (loss) per share – diluted |
$ |
0.29 |
|
|
$ |
0.02 |
|
|
$ |
0.39 |
|
|
$ |
(0.36 |
) |
|
Weighted average common stock outstanding – basic |
|
1,087,863 |
|
|
|
962,692 |
|
|
|
1,050,219 |
|
|
|
945,024 |
|
|
Weighted average common stock outstanding – diluted |
|
1,151,047 |
|
|
|
1,029,303 |
|
|
|
1,101,390 |
|
|
|
945,024 |
|
|
|
|||||||||||||||
|
(1) |
|
In the fourth quarter of 2024, we made a presentation change to present the provision for credit losses below total net revenue and above total noninterest expense , from its previous presentation within total noninterest expense . Respective prior period amounts were recast to conform to the current period presentation. |
Table 2
Non-GAAP Financial Measures
(Unaudited)
A djusted Net Revenue
Adjusted net revenue is a non-GAAP measure. Adjusted net revenue is defined as total net revenue, adjusted to exclude the fair value changes in servicing rights and residual interests classified as debt due to valuation inputs and assumptions changes, which relate only to our Lending segment, as well as gains and losses on extinguishment of debt. We adjust total net revenue to exclude these items, as they are non-cash charges that are not realized during the period or not indicative of our core operating performance, and therefore positive or negative changes do not impact the cash available to fund our operations. Management believes this measure is useful because it enables management and investors to assess our underlying operating performance and cash available to fund our operations. In addition, management uses this measure to better decide on the proper expenses to authorize for each of our operating segments, to ultimately help achieve target contribution profit margins.
The following table reconciles adjusted net revenue to total net revenue, the most directly comparable GAAP measure:
|
|
|
Three Months Ended December 31, |
|
Year Ended December 31, |
||||||||||||
|
($ in thousands) |
|
|
2024 |
|
|
|
2023 |
|
|
|
2024 |
|
|
|
2023 |
|
|
Total net revenue (GAAP) |
|
$ |
734,125 |
|
$ |
615,404 |
|
|
$ |
2,674,859 |
|
|
$ |
2,122,789 |
|
|
|
Servicing rights – change in valuation inputs or assumptions (1) |
|
|
4,962 |
|
|
|
(6,595 |
) |
|
|
(6,280 |
) |
|
|
(34,700 |
) |
|
Residual interests classified as debt – change in valuation inputs or assumptions (2) |
|
|
25 |
|
|
|
10 |
|
|
|
108 |
|
|
|
425 |
|
|
Gain on extinguishment of debt (3) |
|
|
— |
|
|
|
(14,574 |
) |
|
|
(62,517 |
) |
|
|
(14,574 |
) |
|
Adjusted net revenue (non-GAAP) |
|
$ |
739,112 |
|
|
$ |
594,245 |
|
|
$ |
2,606,170 |
|
|
$ |
2,073,940 |
|
|
|
||||||||||||||||
|
(1) |
|
Reflects changes in fair value inputs and assumptions on servicing rights, including conditional prepayment, default rates and discount rates. These assumptions are highly sensitive to market interest rate changes and are not indicative of our performance or results of operations. Moreover, these non-cash charges are unrealized during the period and, therefore, have no impact on our cash flows from operations. |
|
(2) |
|
Reflects changes in fair value inputs and assumptions on residual interests classified as debt, including conditional prepayment, default rates and discount rates. When third parties finance our consolidated securitization VIEs by purchasing residual interests, we receive proceeds at the time of the closing of the securitization and, thereafter, pass along contractual cash flows to the residual interest owner. These residual debt obligations are measured at fair value on a recurring basis, but they have no impact on our initial financing proceeds, our future obligations to the residual interest owner (because future residual interest claims are limited to contractual securitization collateral cash flows), or the general operations of our business. |
|
(3) |
|
Reflects gain on extinguishment of debt. Gains and losses are recognized during the period of extinguishment for the difference between the net carrying amount of debt extinguished and the fair value of equity securities issued. |
The following table reconciles adjusted net revenue for the Lending segment to total net revenue, the most directly comparable GAAP measure for the Lending segment:
|
|
|
Three Months Ended December 31, |
|
Year Ended December 31, |
||||||||||||
|
($ in thousands) |
|
|
2024 |
|
|
|
2023 |
|
|
|
2024 |
|
|
|
2023 |
|
|
Lending |
|
|
|
|
|
|
|
|
||||||||
|
Total net revenue – Lending (GAAP) |
|
$ |
417,796 |
|
$ |
353,126 |
|
|
$ |
1,485,222 |
|
|
$ |
1,370,621 |
|
|
|
Servicing rights – change in valuation inputs or assumptions (1) |
|
|
4,962 |
|
|
|
(6,595 |
) |
|
|
(6,280 |
) |
|
|
(34,700 |
) |
|
Residual interests classified as debt – change in valuation inputs or assumptions (2) |
|
|
25 |
|
|
|
10 |
|
|
|
108 |
|
|
|
425 |
|
|
Adjusted net revenue – Lending (non-GAAP) |
|
$ |
422,783 |
|
|
$ |
346,541 |
|
|
$ |
1,479,050 |
|
|
$ |
1,336,346 |
|
|
|
||||||||||||||||
|
(1) |
|
See footnote (1) to the table above. |
|
(2) |
|
See footnote (2) to the table above. |
Adjusted Noninterest Income
Adjusted noninterest income is a non-GAAP measure. Adjusted noninterest income is defined as noninterest income, adjusted to exclude the fair value changes in servicing rights and residual interests classified as debt due to valuation inputs and assumptions changes, which relate only to our Lending segment, as well as gains and losses on extinguishment of debt. We adjust noninterest income to exclude these items, as they are non-cash charges that are not realized during the period or not indicative of our core operating performance, and therefore positive or negative changes do not impact the cash available to fund our operations. Management believes this measure is useful because it enables management and investors to assess our underlying operating performance and cash available to fund our operations.
The following table reconciles adjusted noninterest income to noninterest income, the most directly comparable GAAP measure:
|
|
|
Three Months Ended December 31, |
|
Year Ended December 31, |
||||||||||||
|
($ in thousands) |
|
|
2024 |
|
|
|
2023 |
|
|
|
2024 |
|
|
|
2023 |
|
|
Noninterest income (GAAP) |
|
$ |
263,956 |
|
$ |
225,763 |
|
|
$ |
958,378 |
|
|
$ |
861,049 |
|
|
|
Servicing rights – change in valuation inputs or assumptions (1) |
|
|
4,962 |
|
|
|
(6,595 |
) |
|
|
(6,280 |
) |
|
|
(34,700 |
) |
|
Residual interests classified as debt – change in valuation inputs or assumptions (2) |
|
|
25 |
|
|
|
10 |
|
|
|
108 |
|
|
|
425 |
|
|
Gain on extinguishment of debt (3) |
|
|
— |
|
|
|
(14,574 |
) |
|
|
(62,517 |
) |
|
|
(14,574 |
) |
|
Adjusted noninterest income (non-GAAP) |
|
$ |
268,943 |
|
|
$ |
204,604 |
|
|
$ |
889,689 |
|
|
$ |
812,200 |
|
|
|
||||||||||||||||
|
(1) |
|
Reflects changes in fair value inputs and assumptions on servicing rights, including conditional prepayment, default rates and discount rates. These assumptions are highly sensitive to market interest rate changes and are not indicative of our performance or results of operations. Moreover, these non-cash charges are unrealized during the period and, therefore, have no impact on our cash flows from operations. |
|
(2) |
|
Reflects changes in fair value inputs and assumptions on residual interests classified as debt, including conditional prepayment, default rates and discount rates. When third parties finance our consolidated securitization VIEs by purchasing residual interests, we receive proceeds at the time of the closing of the securitization and, thereafter, pass along contractual cash flows to the residual interest owner. These residual debt obligations are measured at fair value on a recurring basis, but they have no impact on our initial financing proceeds, our future obligations to the residual interest owner (because future residual interest claims are limited to contractual securitization collateral cash flows), or the general operations of our business. |
|
(3) |
|
Reflects gain on extinguishment of debt. Gains and losses are recognized during the period of extinguishment for the difference between the net carrying amount of debt extinguished and the fair value of equity securities issued. |
The following table reconciles adjusted noninterest income for the Lending segment to noninterest income, the most directly comparable GAAP measure for the Lending segment:
|
|
|
Three Months Ended December 31, |
|
Year Ended December 31, |
||||||||||||
|
($ in thousands) |
|
|
2024 |
|
|
|
2023 |
|
|
|
2024 |
|
|
|
2023 |
|
|
Lending |
|
|
|
|
|
|
|
|
||||||||
|
Noninterest income – Lending (GAAP) |
|
$ |
72,586 |
|
$ |
90,500 |
|
|
$ |
277,996 |
|
|
$ |
409,848 |
|
|
|
Servicing rights – change in valuation inputs or assumptions (1) |
|
|
4,962 |
|
|
|
(6,595 |
) |
|
|
(6,280 |
) |
|
|
(34,700 |
) |
|
Residual interests classified as debt – change in valuation inputs or assumptions (2) |
|
|
25 |
|
|
|
10 |
|
|
|
108 |
|
|
|
425 |
|
|
Adjusted noninterest income – Lending (non-GAAP) |
|
$ |
77,573 |
|
|
$ |
83,915 |
|
|
$ |
271,824 |
|
|
$ |
375,573 |
|
|
|
||||||||||||||||
|
(1) |
|
See footnote (1) to the table above. |
|
(2) |
|
See footnote (2) to the table above. |
Adjusted Contribution Margin and Incremental Adjusted Contribution Margin — Lending
Adjusted contribution margin and incremental adjusted contribution margin are non-GAAP measures and relate only to our Lending segment. Adjusted contribution margin is defined as segment contribution profit (loss) for the Lending segment, divided by adjusted net revenue for the Lending segment, a non-GAAP measure. Incremental adjusted contribution margin is defined as the change in segment contribution profit (loss) for our Lending segment, divided by change in adjusted net revenue for the Lending segment. See ‘ Adjusted Net Revenue’ above for a reconciliation of Lending segment adjusted net revenue.
Management believes adjusted contribution margin metrics are useful because they enable management and investors to assess the underlying operating performance of our Lending segment, by removing the impact of changes in volume over periods to present a comparable view of segment contribution profit (loss), which is a measure of the direct profitability of each of our reportable segments, as a percentage of segment adjusted net revenue for the Lending segment during each period.
The following table presents a reconciliation of adjusted contribution margin and incremental adjusted contribution margin for our reportable Lending segment:
|
|
|
Three Months Ended December 31, |
|
2024 vs 2023 |
|
Year Ended December 31, |
|
2024 vs 2023 |
||||||||||||||||
|
($ in thousands) |
|
|
2024 |
|
|
|
2023 |
|
|
$ Change |
|
|
2024 |
|
|
|
2023 |
|
|
$ Change |
||||
|
Lending |
|
|
|
|
|
|
|
|
|
|
|
|
||||||||||||
|
Contribution profit – Lending (GAAP) |
|
$ |
245,958 |
|
|
$ |
226,110 |
|
|
$ |
19,848 |
|
$ |
890,543 |
|
|
$ |
823,273 |
|
|
$ |
67,270 |
||
|
Net revenue – Lending (GAAP) |
|
|
417,796 |
|
|
|
353,126 |
|
|
|
64,670 |
|
|
|
1,485,222 |
|
|
|
1,370,621 |
|
|
|
114,601 |
|
|
Contribution margin – Lending (GAAP) (1) |
|
|
59 |
% |
|
|
64 |
% |
|
|
|
|
60 |
% |
|
|
60 |
% |
|
|
||||
|
Incremental contribution margin – Lending (GAAP) (1) |
|
|
31 |
% |
|
|
|
|
|
|
59 |
% |
|
|
|
|
||||||||
|
|
|
|
|
|
|
|
|
|
|
|
|
|
||||||||||||
|
Adjusted net revenue – Lending (non-GAAP) (2) |
|
$ |
422,783 |
|
|
$ |
346,541 |
|
|
$ |
76,242 |
|
|
$ |
1,479,050 |
|
|
$ |
1,336,346 |
|
|
$ |
142,704 |
|
|
Adjusted contribution margin – Lending (non-GAAP) |
|
|
58 |
% |
|
|
65 |
% |
|
|
|
|
60 |
% |
|
|
62 |
% |
|
|
||||
|
Incremental adjusted contribution margin – Lending (non-GAAP) |
|
|
26 |
% |
|
|
|
|
|
|
47 |
% |
|
|
|
|
||||||||
|
|
||||||||||||||||||||||||
|
(1) |
|
Contribution margin is defined for each of our reportable segments as contribution profit (loss), divided by net revenue. Incremental contribution margin for each of our reportable segments is defined as the change in segment contribution profit (loss), divided by change in net revenue. |
|
(2) |
|
Refer to ‘ Adjusted Net Revenue ’ above for reconciliation of this non-GAAP measure. |
Adjusted EBITDA, Adjusted EBITDA Margin and Incremental Adjusted EBITDA Margin
Adjusted EBITDA, adjusted EBITDA margin and incremental adjusted EBITDA margin are non-GAAP measures. Adjusted EBITDA is defined as net income (loss), adjusted to exclude, as applicable: (i) corporate borrowing-based interest expense (our adjusted EBITDA measure is not adjusted for warehouse or securitization-based interest expense, nor deposit interest expense and finance lease liability interest expense, as these are direct operating expenses), (ii) income tax expense (benefit), (iii) depreciation and amortization, (iv) share-based expense (inclusive of equity-based payments to non-employees), (v) restructuring charges, (vi) impairment expense (inclusive of goodwill impairment and property, equipment and software abandonments), (vii) transaction-related expenses, (viii) foreign currency impacts related to operations in highly inflationary countries, (ix) fair value changes in each of servicing rights and residual interests classified as debt due to valuation assumptions, (x) gain on extinguishment of debt, and (xi) other charges, as appropriate, that are not expected to recur and are not indicative of our core operating performance.
Adjusted EBITDA margin is computed as adjusted EBITDA divided by adjusted net revenue. Incremental adjusted EBITDA margin is defined as the change in adjusted EBITDA, divided by change in adjusted net revenue. See ‘ Adjusted Net Revenue’ above for a reconciliation of this non-GAAP measure.
Management believes adjusted EBITDA, adjusted EBITDA margin and incremental adjusted EBITDA margin are useful measures for period-over-period comparisons of our business. These measures enable management and investors to assess our core operating performance or results of operations by removing the effects of certain non-cash items and charges, as well as the impact of changes in volume over periods as applicable. In addition, management uses these measures to help evaluate cash flows generated from operations and the extent of additional capital, if any, required to invest in strategic initiatives.
The following table reconciles adjusted EBITDA to net income (loss), the most directly comparable GAAP measure, and presents the computations of adjusted EBITDA margin and incremental adjusted EBITDA margin:
|
|
|
Three Months Ended December 31, |
|
2024 vs 2023 |
|
Year Ended D ecember 31, |
|
2024 vs 2023 |
||||||||||||||||
|
($ in thousands) |
|
|
2024 |
|
|
|
2023 |
|
|
$ Change |
|
|
2024 |
|
|
|
2023 |
|
|
$ Change |
||||
|
Net income (loss) (GAAP) |
|
$ |
332,473 |
|
|
$ |
47,913 |
|
|
$ |
284,560 |
|
|
$ |
498,665 |
|
|
$ |
(300,742 |
) |
|
$ |
799,407 |
|
|
Non-GAAP adjustments: |
|
|
|
|
|
|
|
|
|
|
|
|
||||||||||||
|
Interest expense – corporate borrowings (1) |
|
|
12,039 |
|
|
|
9,882 |
|
|
|
2,157 |
|
|
|
48,346 |
|
|
|
36,833 |
|
|
|
11,513 |
|
|
Income tax expense (benefit) (2) |
|
|
(272,549 |
) |
|
|
3,245 |
|
|
|
(275,794 |
) |
|
|
(265,320 |
) |
|
|
(416 |
) |
|
|
(264,904 |
) |
|
Depreciation and amortization (3) |
|
|
53,545 |
|
|
|
53,449 |
|
|
|
96 |
|
|
|
203,498 |
|
|
|
201,416 |
|
|
|
2,082 |
|
|
Share-based expense |
|
|
66,367 |
|
|
|
69,107 |
|
|
|
(2,740 |
) |
|
|
246,152 |
|
|
|
271,216 |
|
|
|
(25,064 |
) |
|
Restructuring charges (4) |
|
|
255 |
|
|
|
7,796 |
|
|
|
(7,541 |
) |
|
|
1,530 |
|
|
|
12,749 |
|
|
|
(11,219 |
) |
|
Impairment expense (5) |
|
|
— |
|
|
|
— |
|
|
|
— |
|
|
|
— |
|
|
|
248,417 |
|
|
|
(248,417 |
) |
|
Foreign currency impact of highly inflationary subsidiaries (6) |
|
|
840 |
|
|
|
10,971 |
|
|
|
(10,131 |
) |
|
|
1,683 |
|
|
|
10,971 |
|
|
|
(9,288 |
) |
|
Transaction-related expense (7) |
|
|
— |
|
|
|
— |
|
|
|
— |
|
|
|
615 |
|
|
|
142 |
|
|
|
473 |
|
|
Servicing rights – change in valuation inputs or assumptions (8) |
|
|
4,962 |
|
|
|
(6,595 |
) |
|
|
11,557 |
|
|
|
(6,280 |
) |
|
|
(34,700 |
) |
|
|
28,420 |
|
|
Residual interests classified as debt – change in valuation inputs or assumptions (9) |
|
|
25 |
|
|
|
10 |
|
|
|
15 |
|
|
|
108 |
|
|
|
425 |
|
|
|
(317 |
) |
|
Gain on extinguishment of debt (10) |
|
|
— |
|
|
|
(14,574 |
) |
|
|
14,574 |
|
|
|
(62,517 |
) |
|
|
(14,574 |
) |
|
|
(47,943 |
) |
|
Total adjustments |
|
|
(134,516 |
) |
|
|
133,291 |
|
|
|
(267,807 |
) |
|
|
167,815 |
|
|
|
732,479 |
|
|
|
(564,664 |
) |
|
Adjusted EBITDA (non-GAAP) |
|
$ |
197,957 |
|
|
$ |
181,204 |
|
|
$ |
16,753 |
|
|
$ |
666,480 |
|
|
$ |
431,737 |
|
|
$ |
234,743 |
|
|
|
|
|
|
|
|
|
|
|
|
|
|
|
||||||||||||
|
Net income (loss) (GAAP) |
|
$ |
332,473 |
|
|
$ |
47,913 |
|
|
$ |
284,560 |
|
|
$ |
498,665 |
|
|
$ |
(300,742 |
) |
|
$ |
799,407 |
|
|
Total net revenue (GAAP) |
|
|
734,125 |
|
|
|
615,404 |
|
|
|
118,721 |
|
|
|
2,674,859 |
|
|
|
2,122,789 |
|
|
|
552,070 |
|
|
Net income (loss) margin (GAAP) |
|
|
45 |
% |
|
|
8 |
% |
|
|
|
|
19 |
% |
|
|
(14 |
)% |
|
|
||||
|
Incremental net income (loss) margin (GAAP) |
|
|
240 |
% |
|
|
|
|
|
|
145 |
% |
|
|
|
|
||||||||
|
|
|
|
|
|
|
|
|
|
|
|
|
|
||||||||||||
|
Adjusted net revenue (non-GAAP) (11) |
|
$ |
739,112 |
|
|
$ |
594,245 |
|
|
$ |
144,867 |
|
|
$ |
2,606,170 |
|
|
$ |
2,073,940 |
|
|
$ |
532,230 |
|
|
Adjusted EBITDA margin (non-GAAP) |
|
|
27 |
% |
|
|
30 |
% |
|
|
|
|
26 |
% |
|
|
21 |
% |
|
|
||||
|
Incremental adjusted EBITDA margin (non-GAAP) |
|
|
12 |
% |
|
|
|
|
|
|
44 |
% |
|
|
|
|
||||||||
|
|
||||||||||||||||||||||||
|
(1) |
|
Our adjusted EBITDA measure adjusts for corporate borrowing-based interest expense, as these expenses are a function of our capital structure. Corporate borrowing-based interest expense includes interest on our revolving credit facility, as well as interest expense and the amortization of debt discount and debt issuance costs on our convertible notes. Convertible note interest expense in the 2024 periods increased related to the issuance of interest-bearing convertible senior notes during the first quarter of 2024. |
|
(2) |
|
Our income tax position in 2024 was primarily due to the release in the fourth quarter of a $258 million valuation allowance against certain deferred tax assets based on our reassessment of their realizability. Income taxes in 2023 were primarily attributable to income tax benefits from foreign losses in jurisdictions with net deferred tax liabilities related to Technisys, offset by income tax expense associated with the profitability of SoFi Bank in state jurisdictions where separate filings are required, as well as federal taxes where our tax credits and loss carryforwards may be limited. |
|
(3) |
|
Depreciation and amortization expense in 2024 was primarily related to our internally-developed software and intangibles. |
|
(4) |
|
Restructuring charges in 2024 relate to legal entity restructuring. Restructuring charges in 2023 primarily included employee-related wages, benefits and severance associated with a small reduction in headcount in our Technology Platform segment in the first quarter of 2023 and expenses in the fourth quarter of 2023 related to a reduction in headcount across the Company, which do not reflect expected future operating expenses and are not indicative of our core operating performance. |
|
(5) |
|
Impairment expense in 2023 includes $247,174 related to goodwill impairment, and $1,243 related to a sublease arrangement, which are not indicative of our core operating performance. |
|
(6) |
|
Foreign currency charges reflect the impacts of highly inflationary accounting for our operations in Argentina, which are related to our Technology Platform segment and commenced in the first quarter of 2022 with the Technisys Merger. For the year ended December 31, 2023, all amounts were reflected in the fourth quarter, as inter-quarter amounts were determined to be immaterial. Amounts in 2022 were determined to be immaterial. |
|
(7) |
|
Transaction-related expenses in 2024 and 2023 included financial advisory and professional services costs associated with our acquisition of Wyndham. |
|
(8) |
|
Reflects changes in fair value inputs and assumptions, including market servicing costs, conditional prepayment, default rates and discount rates. This non-cash change is unrealized during the period and, therefore, has no impact on our cash flows from operations. As such, these positive and negative changes in fair value attributable to assumption changes are adjusted out of net income (loss) to provide management and financial users with better visibility into the earnings available to finance our operations. |
|
(9) |
|
Reflects changes in fair value inputs and assumptions, including conditional prepayment, default rates and discount rates. When third parties finance our consolidated VIEs through purchasing residual interests, we receive proceeds at the time of the securitization close and, thereafter, pass along contractual cash flows to the residual interest owner. These obligations are measured at fair value on a recurring basis, which has no impact on our initial financing proceeds, our future obligations to the residual interest owner (because future residual interest claims are limited to contractual securitization collateral cash flows), or the general operations of our business. As such, these positive and negative non-cash changes in fair value attributable to assumption changes are adjusted out of net income (loss) to provide management and financial users with better visibility into the earnings available to finance our operations.. |
|
(10) |
|
Reflects gain on extinguishment of debt. Gains and losses are recognized during the period of extinguishment for the difference between the net carrying amount of debt extinguished and the fair value of equity securities issued. |
|
(11) |
|
Refer to ' Adjusted Net Revenue' above for reconciliation of this non-GAAP measure. |
Tangible Book Value and Tangible Book Value per Common Share
Beginning in the fourth quarter of 2024, the company is modifying the presentation of its tangible book value and tangible book value per share, which are non-GAAP measures. Tangible book value is defined as permanent equity, adjusted to exclude goodwill and intangible assets, net of related deferred tax liabilities. Tangible book value per common share represents tangible book value at period-end divided by common stock outstanding at period-end.
Prior to the fourth quarter of 2024, tangible book value was defined as permanent equity, adjusted to exclude goodwill and intangible assets. Tangible book value per common share was defined as tangible book value at period-end divided by diluted weighted average common stock outstanding during the period.
These modifications are intended to enhance investors’ overall understanding of our capital adequacy. Prior period tangible book value and tangible book value per share in this release have been recast to conform with the current presentation. These changes have no impact on any of the company’s previously reported GAAP results for any periods presented.
These measures are utilized by management in assessing our use of equity and capital adequacy. We believe that tangible book value presents a meaningful measure of net asset value, and tangible book value per share provides additional useful information to investors to assess capital adequacy.
The following table reconciles tangible book value to permanent equity, the most directly comparable GAAP measure, and presents the computation of permanent equity per common share and tangible book value per common share for the periods presented:
|
($ and shares in thousands, except per share amounts) |
|
December 31, 2 024 |
|
December 31, 2 023 |
||||
|
Permanent equity (GAAP) |
|
$ |
6,525,134 |
|
|
$ |
5,234,612 |
|
|
Non-GAAP adjustments: |
|
|
|
|
||||
|
Goodwill |
|
|
(1,393,505 |
) |
|
|
(1,393,505 |
) |
|
Intangible assets |
|
|
(297,794 |
) |
|
|
(364,048 |
) |
|
Related deferred tax liabilities |
|
|
60,088 |
|
|
|
44,139 |
|
|
Tangible book value (as of period end) (non-GAAP) |
|
$ |
4,893,923 |
|
|
$ |
3,521,198 |
|
|
|
|
|
|
|
||||
|
Common stock outstanding (as of period end) |
|
|
1,095,358 |
|
|
|
975,862 |
|
|
|
|
|
|
|
||||
|
Permanent equity per common share (GAAP) |
|
$ |
5.96 |
|
|
$ |
5.36 |
|
|
Tangible book value per common share (non-GAAP) |
|
$ |
4.47 |
|
|
$ |
3.61 |
|
The following tables present tangible book value and tangible book value per share recast to conform with current period presentation.
|
($ and shares in thousands, except per share amounts) |
|
December 31, 2 024 |
|
September 30, 2 024 |
|
June 30, 2 024 |
|
March 31, 2 024 |
|
December 31, 2 023 |
|
September 30, 2 023 |
|
June 30, 2 023 |
|
March 31, 2 023 |
|
December 31, 2 022 |
|
June 30, 2 022 |
|
September 30, 2 022 |
|
March 31, 2 022 |
||||||||||||||||||||||||
|
Permanent equity (GAAP) |
|
$ |
6,525,134 |
|
|
$ |
6,121,481 |
|
|
$ |
5,901,494 |
|
|
$ |
5,825,605 |
|
|
$ |
5,234,612 |
|
|
$ |
5,053,388 |
|
|
$ |
5,257,661 |
|
|
$ |
5,234,072 |
|
|
$ |
5,208,102 |
|
|
$ |
5,181,003 |
|
|
$ |
5,186,180 |
|
|
$ |
5,210,299 |
|
|
Non-GAAP adjustments: |
|
|
|
|
|
|
|
|
|
|
|
|
|
|
|
|
|
|
|
|
|
|
|
|
||||||||||||||||||||||||
|
Goodwill |
|
|
(1,393,505 |
) |
|
|
(1,393,505 |
) |
|
|
(1,393,505 |
) |
|
|
(1,393,505 |
) |
|
|
(1,393,505 |
) |
|
|
(1,393,505 |
) |
|
|
(1,640,679 |
) |
|
|
(1,622,991 |
) |
|
|
(1,622,991 |
) |
|
|
(1,622,951 |
) |
|
|
(1,625,375 |
) |
|
|
(1,615,694 |
) |
|
Intangible assets |
|
|
(297,794 |
) |
|
|
(314,959 |
) |
|
|
(331,446 |
) |
|
|
(347,495 |
) |
|
|
(364,048 |
) |
|
|
(387,307 |
) |
|
|
(412,099 |
) |
|
|
(419,880 |
) |
|
|
(442,155 |
) |
|
|
(456,771 |
) |
|
|
(481,124 |
) |
|
|
(505,526 |
) |
|
Related deferred tax liabilities |
|
|
60,088 |
|
|
|
15,654 |
|
|
|
24,023 |
|
|
|
30,437 |
|
|
|
44,139 |
|
|
|
76,892 |
|
|
|
78,995 |
|
|
|
88,502 |
|
|
|
101,972 |
|
|
|
123,929 |
|
|
|
135,396 |
|
|
|
131,002 |
|
|
Tangible book value (as of period end) (non-GAAP) |
|
$ |
4,893,923 |
|
|
$ |
4,428,671 |
|
|
$ |
4,200,566 |
|
|
$ |
4,115,042 |
|
|
$ |
3,521,198 |
|
|
$ |
3,349,468 |
|
|
$ |
3,283,878 |
|
|
$ |
3,279,703 |
|
|
$ |
3,244,928 |
|
|
$ |
3,225,210 |
|
|
$ |
3,215,077 |
|
|
$ |
3,220,081 |
|
|
|
|
|
|
|
|
|
|
|
|
|
|
|
|
|
|
|
|
|
|
|
|
|
|
|
||||||||||||||||||||||||
|
Common stock outstanding (as of period end) |
|
|
1,095,358 |
|
|
|
1,084,137 |
|
|
|
1,065,112 |
|
|
|
1,056,491 |
|
|
|
975,862 |
|
|
|
957,860 |
|
|
|
948,913 |
|
|
|
940,339 |
|
|
|
933,896 |
|
|
|
927,346 |
|
|
|
922,103 |
|
|
|
915,674 |
|
|
|
|
|
|
|
|
|
|
|
|
|
|
|
|
|
|
|
|
|
|
|
|
|
|
|
||||||||||||||||||||||||
|
Permanent equity per common share (GAAP) |
|
$ |
5.96 |
|
|
$ |
5.65 |
|
|
$ |
5.54 |
|
|
$ |
5.51 |
|
|
$ |
5.36 |
|
|
$ |
5.28 |
|
|
$ |
5.54 |
|
|
$ |
5.57 |
|
|
$ |
5.58 |
|
|
$ |
5.59 |
|
|
$ |
5.62 |
|
|
$ |
5.69 |
|
|
Tangible book value per common share (non-GAAP) |
|
$ |
4.47 |
|
|
$ |
4.08 |
|
|
$ |
3.94 |
|
|
$ |
3.90 |
|
|
$ |
3.61 |
|
|
$ |
3.50 |
|
|
$ |
3.46 |
|
|
$ |
3.49 |
|
|
$ |
3.47 |
|
|
$ |
3.48 |
|
|
$ |
3.49 |
|
|
$ |
3.52 |
|
Adjusted Net Income (Loss), Adjusted Net Income Margin, Incremental Adjusted Net Income Margin and Adjusted EPS
Adjusted net income (loss), adjusted net income margin, incremental adjusted net income margin and adjusted diluted earnings (loss) are non-GAAP measures. Adjusted net income (loss) is defined as net income (loss), adjusted to exclude, as applicable, goodwill impairment expense and certain income tax benefits that are not expected to recur and are not indicative of our core operating performance.
Adjusted diluted earnings (loss) per share ("adjusted EPS") is a non-GAAP financial measure that adjusts GAAP diluted earnings (loss) per share. Adjusted EPS is computed by dividing net income (loss) attributable to common stockholders, adjusted to exclude, as applicable, goodwill impairment expense and certain income tax benefits that are not expected to recur and are not indicative of our core operating performance, by the diluted weighted average number of shares of common stock outstanding during the period.
Adjusted net income margin is computed as adjusted net income (loss) divided by adjusted net revenue. Incremental adjusted net income margin is defined as the change in adjusted net income (loss), divided by change in adjusted net revenue. See ‘ Adjusted Net Revenue’ above for a reconciliation of this non-GAAP measure.
Management believes adjusted net income (loss), adjusted net income margin, incremental adjusted net income margin and adjusted EPS are useful because they enable management and investors to assess our core operating performance or results of operations, by removing the effects of certain non cash items and charges to present a comparable view for period over period comparisons of our business.
The following table: (i) reconciles adjusted net income (loss) to net income (loss), the most directly comparable GAAP measure, (ii) reconciles adjusted EPS to diluted earnings (loss) per share, the most directly comparable GAAP measure, and (iii) presents the computations of adjusted net income margin and incremental adjusted net income margin.
|
|
|
Three Months Ended December 31, |
|
2024 vs 2023 |
|
Year Ended December 31, |
|
2024 vs 2023 |
||||||||||||||||
|
($ and shares in thousands, except per share amounts) |
|
|
2024 |
|
|
|
2023 |
|
|
$ Change |
|
|
2024 |
|
|
|
2023 |
|
|
$ Change |
||||
|
Net income (loss) (GAAP) |
|
$ |
332,473 |
|
|
$ |
47,913 |
|
|
$ |
284,560 |
|
|
$ |
498,665 |
|
|
$ |
(300,742 |
) |
|
$ |
799,407 |
|
|
Non-GAAP adjustments: |
|
|
|
|
|
|
|
|
|
|
|
|
||||||||||||
|
Income tax benefit from release of tax valuation allowance |
|
|
(258,401 |
) |
|
|
— |
|
|
|
(258,401 |
) |
|
|
(258,401 |
) |
|
|
— |
|
|
|
(258,401 |
) |
|
Income tax benefit from restructuring |
|
|
(13,042 |
) |
|
|
— |
|
|
|
(13,042 |
) |
|
|
(13,042 |
) |
|
|
— |
|
|
|
(13,042 |
) |
|
Goodwill impairment expense |
|
|
— |
|
|
|
— |
|
|
|
— |
|
|
|
— |
|
|
|
247,174 |
|
|
|
(247,174 |
) |
|
Adjusted net income (loss) (non-GAAP) |
|
$ |
61,030 |
|
|
$ |
47,913 |
|
|
$ |
13,117 |
|
|
$ |
227,222 |
|
|
$ |
(53,568 |
) |
|
$ |
280,790 |
|
|
|
|
|
|
|
|
|
|
|
|
|
|
|
||||||||||||
|
Numerator: |
|
|
|
|
|
|
|
|
|
|
|
|
||||||||||||
|
Net income (loss) attributable to common stockholders – diluted (GAAP) (1) |
|
$ |
332,473 |
|
|
$ |
24,615 |
|
|
|
|
$ |
434,776 |
|
|
$ |
(341,167 |
) |
|
|
||||
|
Non-GAAP adjustments: |
|
|
|
|
|
|
|
|
|
|
|
|
||||||||||||
|
Income tax benefit from release of tax valuation allowance |
|
|
(258,401 |
) |
|
|
— |
|
|
|
|
|
(258,401 |
) |
|
|
— |
|
|
|
||||
|
Income tax benefit from restructuring |
|
|
(13,042 |
) |
|
|
— |
|
|
|
|
|
(13,042 |
) |
|
|
— |
|
|
|
||||
|
Goodwill impairment expense |
|
|
— |
|
|
|
— |
|
|
|
|
|
— |
|
|
|
247,174 |
|
|
|
||||
|
Adjusted net income (loss) attributable to common stockholders – diluted (non-GAAP) |
|
$ |
61,030 |
|
|
$ |
24,615 |
|
|
|
|
$ |
163,333 |
|
|
$ |
(93,993 |
) |
|
|
||||
|
Denominator: |
|
|
|
|
|
|
|
|
|
|
|
|
||||||||||||
|
Weighted average common stock outstanding – diluted |
|
|
1,151,047 |
|
|
|
1,029,303 |
|
|
|
|
|
1,101,390 |
|
|
|
945,024 |
|
|
|
||||
|
|
|
|
|
|
|
|
|
|
|
|
|
|
||||||||||||
|
Earnings (loss) per share – diluted (GAAP) (1) |
|
$ |
0.29 |
|
|
$ |
0.02 |
|
|
|
|
$ |
0.39 |
|
|
$ |
(0.36 |
) |
|
|
||||
|
Impact of adjustments per share |
|
|
(0.24 |
) |
|
|
— |
|
|
|
|
|
(0.24 |
) |
|
|
0.26 |
|
|
|
||||
|
Adjusted earnings (loss) per share – diluted (non-GAAP) (1) |
|
$ |
0.05 |
|
|
$ |
0.02 |
|
|
|
|
$ |
0.15 |
|
|
$ |
(0.10 |
) |
|
|
||||
|
|
|
|
|
|
|
|
|
|
|
|
|
|
||||||||||||
|
Net income (loss) margin (GAAP) |
|
|
45 |
% |
|
|
8 |
% |
|
|
|
|
19 |
% |
|
|
(14 |
)% |
|
|
||||
|
|
|
|
|
|
|
|
|
|
|
|
|
|
||||||||||||
|
Adjusted net revenue (non-GAAP) (2) |
|
$ |
739,112 |
|
|
$ |
594,245 |
|
|
|
|
$ |
2,606,170 |
|
|
$ |
2,073,940 |
|
|
|
||||
|
Adjusted net income margin (non-GAAP) |
|
|
8 |
% |
|
|
8 |
% |
|
|
|
|
9 |
% |
|
|
(3 |
)% |
|
|
||||
|
Incremental adjusted net income margin (non-GAAP) |
|
|
9 |
% |
|
|
|
|
|
|
53 |
% |
|
|
|
|
||||||||
|
|
||||||||||||||||||||||||
|
(1) |
|
For the year ended December 31, 2024, diluted earnings per share and diluted net income attributable to common stockholders exclude gain on extinguishment of debt, net of tax, as well as interest expense incurred, net of tax, associated with convertible note activity during the period as evaluated under the if-converted method. |
|
(2) |
|
Refer to ' Adjusted Net Revenue' above for reconciliation of this non-GAAP measure. |
|
|
|
Table 3 |
|||||||
|
|
|||||||
|
SoFi Technologies, Inc. Condensed Consolidated Balance Sheets (Unaudited) (In Thousands, Except for Share Data) |
|||||||
|
|
|||||||
|
|
December 31, 2 024 |
|
December 31, 2 023 |
||||
|
Assets |
|
|
|
||||
|
Cash and cash equivalents |
$ |
2,538,293 |
|
|
$ |
3,085,020 |
|
|
Restricted cash and restricted cash equivalents |
|
171,067 |
|
|
|
530,558 |
|
|
Investment securities (includes available-for-sale securities of $1,804,043 and $595,187 at fair value with associated amortized cost of $1,807,686 and $596,757, as of December 31, 2024 and December 31, 2023, respectively) |
|
1,895,689 |
|
|
|
701,935 |
|
|
Loans held for sale, at fair value |
|
17,684,892 |
|
|
|
15,396,771 |
|
|
Loans held for investment, at fair value |
|
8,597,368 |
|
|
|
6,725,484 |
|
|
Loans held for investment, at amortized cost (less allowance for credit losses of $46,684 and $54,695, as of December 31, 2024 and December 31, 2023, respectively) |
|
1,246,458 |
|
|
|
836,159 |
|
|
Servicing rights |
|
342,128 |
|
|
|
180,469 |
|
|
Property, equipment and software |
|
287,869 |
|
|
|
216,908 |
|
|
Goodwill |
|
1,393,505 |
|
|
|
1,393,505 |
|
|
Intangible assets |
|
297,794 |
|
|
|
364,048 |
|
|
Operating lease right-of-use assets |
|
81,219 |
|
|
|
89,635 |
|
|
Other assets (less allowance for credit losses of $2,444 and $1,837, as of December 31, 2024 and December 31, 2023, respectively) |
|
1,714,669 |
|
|
|
554,366 |
|
|
Total assets |
$ |
36,250,951 |
|
|
$ |
30,074,858 |
|
|
Liabilities, temporary equity and permanent equity |
|
|
|
||||
|
Liabilities: |
|
|
|
||||
|
Deposits: |
|
|
|
||||
|
Interest-bearing deposits |
$ |
25,861,400 |
|
|
$ |
18,568,993 |
|
|
Noninterest-bearing deposits |
|
116,804 |
|
|
|
51,670 |
|
|
Total deposits |
|
25,978,204 |
|
|
|
18,620,663 |
|
|
Accounts payable, accruals and other liabilities |
|
556,923 |
|
|
|
549,748 |
|
|
Operating lease liabilities |
|
97,389 |
|
|
|
108,649 |
|
|
Debt |
|
3,092,692 |
|
|
|
5,233,416 |
|
|
Residual interests classified as debt |
|
609 |
|
|
|
7,396 |
|
|
Total liabilities |
|
29,725,817 |
|
|
|
24,519,872 |
|
|
Commitments, guarantees, concentrations and contingencies |
|
|
|
||||
|
Temporary equity: |
|
|
|
||||
|
Redeemable preferred stock, $0.00 par value: 100,000,000 and 100,000,000 shares authorized; — and 3,234,000 shares issued and outstanding as of December 31, 2024 and December 31, 2023, respectively |
|
— |
|
|
|
320,374 |
|
|
Permanent equity: |
|
|
|
||||
|
Common stock, $0.00 par value: 3,100,000,000 and 3,100,000,000 shares authorized; 1,095,357,781 and 975,861,793 shares issued and outstanding as of December 31, 2024 and December 31, 2023, respectively |
|
109 |
|
|
|
97 |
|
|
Additional paid-in capital |
|
7,838,988 |
|
|
|
7,039,987 |
|
|
Accumulated other comprehensive loss |
|
(8,365 |
) |
|
|
(1,209 |
) |
|
Accumulated deficit |
|
(1,305,598 |
) |
|
|
(1,804,263 |
) |
|
Total permanent equity |
|
6,525,134 |
|
|
|
5,234,612 |
|
|
Total liabilities, temporary equity and permanent equity |
$ |
36,250,951 |
|
|
$ |
30,074,858 |
|
|
|
|||||||
|
Table 4 |
||||||||||||||||||||||
|
|
||||||||||||||||||||||
|
SoFi Technologies, Inc. Average Balances and Net Interest Earnings Analysis (Unaudited) |
||||||||||||||||||||||
|
|
||||||||||||||||||||||
|
|
|
Three Months Ended December 31, 2024 |
|
Three Months Ended December 31, 2023 |
||||||||||||||||||
|
($ in thousands) |
|
Average Balances |
|
Interest Income/Expense |
|
Average Yield/Rate |
|
Average Balances |
|
Interest Income/Expense |
|
Average Yield/Rate |
||||||||||
|
Assets |
|
|
|
|
|
|
|
|
|
|
|
|
||||||||||
|
Interest-earning assets: |
|
|
|
|
|
|
|
|
|
|
|
|
||||||||||
|
Interest-bearing deposits with banks |
|
$ |
2,802,974 |
|
$ |
32,070 |
|
4.55 |
% |
|
$ |
2,675,248 |
|
$ |
34,217 |
|
5.07 |
% |
||||
|
Investment securities |
|
|
1,798,995 |
|
|
|
24,577 |
|
|
5.44 |
|
|
|
697,032 |
|
|
|
13,837 |
|
|
7.88 |
|
|
Loans |
|
|
27,068,505 |
|
|
|
687,290 |
|
|
10.10 |
|
|
|
22,326,117 |
|
|
|
597,183 |
|
|
10.61 |
|
|
Total interest-earning assets |
|
|
31,670,474 |
|
|
|
743,937 |
|
|
9.34 |
|
|
|
25,698,397 |
|
|
|
645,237 |
|
|
9.96 |
|
|
Total noninterest-earning assets |
|
|
3,641,532 |
|
|
|
|
|
|
|
2,879,773 |
|
|
|
|
|
||||||
|
Total assets |
|
$ |
35,312,006 |
|
|
|
|
|
|
$ |
28,578,170 |
|
|
|
|
|
||||||
|
Liabilities, Temporary Equity and Permanent Equity |
|
|
|
|
|
|
|
|
|
|
|
|
||||||||||
|
Interest-bearing liabilities: |
|
|
|
|
|
|
|
|
|
|
|
|
||||||||||
|
Demand deposits |
|
$ |
2,171,856 |
|
|
$ |
8,189 |
|
|
1.50 |
% |
|
$ |
2,553,537 |
|
|
$ |
13,062 |
|
|
2.03 |
% |
|
Savings deposits |
|
|
21,626,757 |
|
|
|
216,389 |
|
|
3.98 |
|
|
|
11,664,436 |
|
|
|
133,795 |
|
|
4.55 |
|
|
Time deposits |
|
|
1,184,996 |
|
|
|
14,018 |
|
|
4.71 |
|
|
|
2,719,390 |
|
|
|
35,755 |
|
|
5.22 |
|
|
Total interest-bearing deposits |
|
|
24,983,609 |
|
|
|
238,596 |
|
|
3.80 |
|
|
|
16,937,363 |
|
|
|
182,612 |
|
|
4.28 |
|
|
Warehouse facilities |
|
|
1,462,228 |
|
|
|
21,050 |
|
|
5.73 |
|
|
|
3,285,127 |
|
|
|
53,473 |
|
|
6.46 |
|
|
Securitization debt |
|
|
87,429 |
|
|
|
680 |
|
|
3.09 |
|
|
|
543,152 |
|
|
|
6,283 |
|
|
4.59 |
|
|
Other debt |
|
|
1,754,166 |
|
|
|
13,442 |
|
|
3.05 |
|
|
|
1,626,551 |
|
|
|
13,228 |
|
|
3.23 |
|
|
Total debt |
|
|
3,303,823 |
|
|
|
35,172 |
|
|
4.24 |
|
|
|
5,454,830 |
|
|
|
72,984 |
|
|
5.31 |
|
|
Residual interests classified as debt |
|
|
626 |
|
|
|
— |
|
|
— |
|
|
|
9,192 |
|
|
|
— |
|
|
— |
|
|
Total interest-bearing liabilities |
|
|
28,288,058 |
|
|
|
273,768 |
|
|
3.85 |
|
|
|
22,401,385 |
|
|
|
255,596 |
|
|
4.53 |
|
|
Total noninterest-bearing liabilities |
|
|
763,688 |
|
|
|
|
|
|
|
761,532 |
|
|
|
|
|
||||||
|
Total liabilities |
|
|
29,051,746 |
|
|
|
|
|
|
|
23,162,917 |
|
|
|
|
|
||||||
|
Total temporary equity |
|
|
— |
|
|
|
|
|
|
|
320,374 |
|
|
|
|
|
||||||
|
Total permanent equity |
|
|
6,260,260 |
|
|
|
|
|
|
|
5,094,879 |
|
|
|
|
|
||||||
|
Total liabilities, temporary equity and permanent equity |
|
$ |
35,312,006 |
|
|
|
|
|
|
$ |
28,578,170 |
|
|
|
|
|
||||||
|
|
|
|
|
|
|
|
|
|
|
|
|
|
||||||||||
|
Net interest income |
|
|
|
$ |
470,169 |
|
|
|
|
|
|
$ |
389,641 |
|
|
|
||||||
|
Net interest margin |
|
|
|
|
|
5.91 |
% |
|
|
|
|
|
6.02 |
% |
||||||||
|
|
|
Year Ended December 31, 2024 |
|
Year Ended December 31, 2023 |
||||||||||||||||||
|
($ in thousands) |
|
Average Balances |
|
Interest Income/Expense |
|
Average Yield/Rate |
|
Average Balances |
|
Interest Income/Expense |
|
Average Yield/Rate |
||||||||||
|
Assets |
|
|
|
|
|
|
|
|
|
|
|
|
||||||||||
|
Interest-earning assets: |
|
|
|
|
|
|
|
|
|
|
|
|
||||||||||
|
Interest-bearing deposits with banks |
|
$ |
2,814,098 |
|
$ |
133,686 |
|
4.75 |
% |
|
$ |
2,172,013 |
|
$ |
91,312 |
|
4.20 |
% |
||||
|
Investment securities |
|
|
1,412,821 |
|
|
|
79,338 |
|
|
5.62 |
|
|
|
541,590 |
|
|
|
25,096 |
|
|
4.63 |
|
|
Loans |
|
|
25,360,067 |
|
|
|
2,594,793 |
|
|
10.23 |
|
|
|
18,733,812 |
|
|
|
1,934,659 |
|
|
10.33 |
|
|
Total interest-earning assets |
|
|
29,586,986 |
|
|
|
2,807,817 |
|
|
9.49 |
|
|
|
21,447,415 |
|
|
|
2,051,067 |
|
|
9.56 |
|
|
Total noninterest-earning assets |
|
|
3,305,102 |
|
|
|
|
|
|
|
3,055,580 |
|
|
|
|
|
||||||
|
Total assets |
|
$ |
32,892,088 |
|
|
|
|
|
|
$ |
24,502,995 |
|
|
|
|
|
||||||
|
Liabilities, Temporary Equity and Permanent Equity |
|
|
|
|
|
|
|
|
|
|
|
|
||||||||||
|
Interest-bearing liabilities: |
|
|
|
|
|
|
|
|
|
|
|
|
||||||||||
|
Demand deposits |
|
$ |
2,167,328 |
|
|
$ |
45,117 |
|
|
2.08 |
% |
|
$ |
2,214,794 |
|
|
$ |
51,673 |
|
|
2.33 |
% |
|
Savings deposits |
|
|
18,385,550 |
|
|
|
782,205 |
|
|
4.25 |
|
|
|
8,481,895 |
|
|
|
359,444 |
|
|
4.24 |
|
|
Time deposits |
|
|
2,060,959 |
|
|
|
102,832 |
|
|
4.99 |
|
|
|
1,958,002 |
|
|
|
96,703 |
|
|
4.94 |
|
|
Total interest-bearing deposits |
|
|
22,613,837 |
|
|
|
930,154 |
|
|
4.11 |
|
|
|
12,654,691 |
|
|
|
507,820 |
|
|
4.01 |
|
|
Warehouse facilities |
|
|
1,555,603 |
|
|
|
97,781 |
|
|
6.29 |
|
|
|
3,142,096 |
|
|
|
192,987 |
|
|
6.14 |
|
|
Securitization debt |
|
|
188,855 |
|
|
|
7,197 |
|
|
3.81 |
|
|
|
751,869 |
|
|
|
36,853 |
|
|
4.90 |
|
|
Other debt |
|
|
1,782,732 |
|
|
|
56,204 |
|
|
3.15 |
|
|
|
1,638,748 |
|
|
|
51,526 |
|
|
3.14 |
|
|
Total debt |
|
|
3,527,190 |
|
|
|
161,182 |
|
|
4.57 |
|
|
|
5,532,713 |
|
|
|
281,366 |
|
|
5.09 |
|
|
Residual interests classified as debt |
|
|
2,495 |
|
|
|
— |
|
|
— |
|
|
|
12,301 |
|
|
|
141 |
|
|
1.15 |
|
|
Total interest-bearing liabilities |
|
|
26,143,522 |
|
|
|
1,091,336 |
|
|
4.17 |
|
|
|
18,199,705 |
|
|
|
789,327 |
|
|
4.34 |
|
|
Total noninterest-bearing liabilities |
|
|
753,979 |
|
|
|
|
|
|
|
757,070 |
|
|
|
|
|
||||||
|
Total liabilities |
|
|
26,897,501 |
|
|
|
|
|
|
|
18,956,775 |
|
|
|
|
|
||||||
|
Total temporary equity |
|
|
123,221 |
|
|
|
|
|
|
|
320,374 |
|
|
|
|
|
||||||
|
Total permanent equity |
|
|
5,871,366 |
|
|
|
|
|
|
|
5,225,846 |
|
|
|
|
|
||||||
|
Total liabilities, temporary equity and permanent equity |
|
$ |
32,892,088 |
|
|
|
|
|
|
$ |
24,502,995 |
|
|
|
|
|
||||||
|
|
|
|
|
|
|
|
|
|
|
|
|
|
||||||||||
|
Net interest income |
|
|
|
$ |
1,716,481 |
|
|
|
|
|
|
$ |
1,261,740 |
|
|
|
||||||
|
Net interest margin |
|
|
|
|
|
5.80 |
% |
|
|
|
|
|
5.88 |
% |
||||||||
|
|
||||||||||||||||||||||
|
Table 5 |
|||||||
|
|
|||||||
|
SoFi Technologies, Inc. Condensed Consolidated Cash Flow Data (Unaudited) (In Thousands) |
|||||||
|
|
|||||||
|
|
Year Ended December 31, |
||||||
|
|
|
2024 |
|
|
|
2023 |
|
|
Net cash used in operating activities |
$ |
(1,119,807 |
) |
|
$ |
(7,227,139 |
) |
|
Net cash used in investing activities |
|
(4,820,990 |
) |
|
|
(1,889,864 |
) |
|
Net cash provided by financing activities |
|
5,034,577 |
|
|
|
10,885,602 |
|
|
Effect of exchange rates on cash and cash equivalents |
|
2 |
|
|
|
677 |
|
|
Net increase (decrease) in cash, cash equivalents, restricted cash and restricted cash equivalents |
$ |
(906,218 |
) |
|
$ |
1,769,276 |
|
|
Cash, cash equivalents, restricted cash and restricted cash equivalents at beginning of period |
|
3,615,578 |
|
|
|
1,846,302 |
|
|
Cash, cash equivalents, restricted cash and restricted cash equivalents at end of period |
$ |
2,709,360 |
|
|
$ |
3,615,578 |
|
|
|
|||||||
|
Table 6 |
|||||||||||||||||
|
|
|||||||||||||||||
|
Company Metrics |
|||||||||||||||||
|
|
|||||||||||||||||
|
|
December 31, 2 024 |
|
September 30, 2 024 |
|
June 30, 2 024 |
|
March 31, 2 024 |
|
December 31, 2 023 |
|
September 30, 2 023 |
|
June 30, 2 023 |
|
March 31, 2 023 |
|
December 31, 2 022 |
|
Members |
10,127,323 |
|
9,372,615 |
|
8,774,236 |
|
8,131,720 |
|
7,541,860 |
|
6,957,187 |
|
6,240,091 |
|
5,655,711 |
|
5,222,533 |
|
Total Products |
14,745,435 |
|
13,650,730 |
|
12,776,430 |
|
11,830,128 |
|
11,142,476 |
|
10,447,806 |
|
9,401,025 |
|
8,554,363 |
|
7,894,636 |
|
Total Products — Lending segment |
2,010,354 |
|
1,890,761 |
|
1,786,580 |
|
1,705,155 |
|
1,663,006 |
|
1,593,906 |
|
1,503,892 |
|
1,416,122 |
|
1,340,597 |
|
Total Products — Financial Services segment |
12,735,081 |
|
11,759,969 |
|
10,989,850 |
|
10,124,973 |
|
9,479,470 |
|
8,853,900 |
|
7,897,133 |
|
7,138,241 |
|
6,554,039 |
|
Total Accounts — Technology Platform segment |
167,713,818 |
|
160,179,299 |
|
158,485,125 |
|
151,049,375 |
|
145,425,391 |
|
136,739,131 |
|
129,356,203 |
|
126,326,916 |
|
130,704,351 |
|
|
|
|
|
|
|
|
|
|
|
|
|
|
|
|
|
|
|
|
Total Products, excluding digital assets (1) |
14,745,435 |
|
13,650,730 |
|
12,776,430 |
|
11,830,128 |
|
10,876,881 |
|
9,984,685 |
|
8,965,949 |
|
8,139,065 |
|
7,497,761 |
|
Total Products, excluding digital assets — Financial Services segment (1) |
12,735,081 |
|
11,759,969 |
|
10,989,850 |
|
10,124,973 |
|
9,213,875 |
|
8,390,779 |
|
7,462,057 |
|
6,722,943 |
|
6,157,164 |
|
SoFi Invest, excluding digital assets (1) |
2,525,059 |
|
2,394,367 |
|
2,332,045 |
|
2,224,705 |
|
2,115,046 |
|
2,001,951 |
|
1,880,701 |
|
1,795,617 |
|
1,761,989 |
|
|
|||||||||||||||||
|
(1) |
|
In the fourth quarter of 2023, we transferred the crypto services provided by SoFi Digital Assets, LLC, and began closing existing digital assets accounts and removing the account from Invest products. This process was completed in the first quarter of 2024. |
Members
We refer to our customers as "members". We define a member as someone who has a lending relationship with us through origination and/or ongoing servicing, opened a financial services account, linked an external account to our platform or signed up for our credit score monitoring service. Our members have access to our CFPs, our member events, our content, educational material, news, and our tools and calculators, which are provided at no cost to the member. We view members as an indication not only of the size and a measurement of growth of our business, but also as a measure of the significant value of the data we have collected over time.
Once someone becomes a member, they are always considered a member unless they are removed in accordance with our terms of service, in which case, we adjust our total number of members. This could occur for a variety of reasons—including fraud or pursuant to certain legal processes—and, as our terms of service evolve together with our business practices, product offerings and applicable regulations, our grounds for removing members from our total member count could change. The determination that a member should be removed in accordance with our terms of service is subject to an evaluation process, following the completion, and based on the results, of which, relevant members and their associated products are removed from our total member count in the period in which such evaluation process concludes. However, depending on the length of the evaluation process, that removal may not take place in the same period in which the member was added to our member count or the same period in which the circumstances leading to their removal occurred. For this reason, our total member count may not yet reflect adjustments that may be made once ongoing evaluation processes, if any, conclude. Beginning in the first quarter of 2024, we aligned our methodology for calculating member and product metrics with our member and product definitions to include co-borrowers, co-signers, and joint- and co-account holders, as applicable. Quarterly amounts for prior periods were determined to be immaterial and were not recast.
Total Products
Total products refers to the aggregate number of lending and financial services products that our members have selected on our platform since our inception through the reporting date, whether or not the members are still registered for such products. Total products is a primary indicator of the size and reach of our Lending and Financial Services segments. Management relies on total products metrics to understand the effectiveness of our member acquisition efforts and to gauge the propensity for members to use more than one product.
In our Lending segment, total products refers to the number of personal loans, student loans and home loans that have been originated through our platform through the reporting date, inclusive of loans which we originate as part of our Loan Platform Business, whether or not such loans have been paid off. If a member has multiple loan products of the same loan product type, such as two personal loans, that is counted as a single product. However, if a member has multiple loan products across loan product types, such as one personal loan and one home loan, that is counted as two products. The account of a co-borrower or co-signer is not considered a separate lending product.
In our Financial Services segment, total products refers to the number of SoFi Money accounts (inclusive of checking and savings accounts held at SoFi Bank and cash management accounts), SoFi Invest accounts, SoFi Credit Card accounts (including accounts with a zero dollar balance at the reporting date), referred loans (which are originated by a third-party partner to which we provide pre-qualified borrower referrals), SoFi At Work accounts and SoFi Relay accounts (with either credit score monitoring enabled or external linked accounts) that have been opened through our platform through the reporting date. Checking and savings accounts are considered one account within our total products metric. Our SoFi Invest service is composed of two products: active investing accounts and robo-advisory accounts. Our members can select any one or combination of the types of SoFi Invest products. If a member has multiple SoFi Invest products of the same account type, such as two active investing accounts, that is counted as a single product. However, if a member has multiple SoFi Invest products across account types, such as one active investing account and one robo-advisory account, those separate account types are considered separate products. The account of a joint- or co-account holder is considered a separate financial services product. In the event a member is removed in accordance with our terms of service, as discussed under "Members" above, the member’s associated products are also removed.
Technology Platform Total Accounts
In our Technology Platform segment, total accounts refers to the number of open accounts at Galileo as of the reporting date. We include intercompany accounts on the Galileo platform as a service in our total accounts metric to better align with the Technology Platform segment revenue which includes intercompany revenue. Intercompany revenue is eliminated in consolidation. Total accounts is a primary indicator of the accounts dependent upon our technology platform to use virtual card products, virtual wallets, make peer-to-peer and bank-to-bank transfers, receive early paychecks, separate savings from spending balances, make debit transactions and rely upon real-time authorizations, all of which result in revenues for the Technology Platform segment. We do not measure total accounts for the Technisys products and solutions, as the revenue model is not primarily dependent upon being a fully integrated, stand-ready service.
|
Table 7 |
||||||||||||||||||||||||||||||||||||
|
|
||||||||||||||||||||||||||||||||||||
|
Segment Financials (Unaudited) |
||||||||||||||||||||||||||||||||||||
|
|
||||||||||||||||||||||||||||||||||||
|
|
|
Quarter Ended |
||||||||||||||||||||||||||||||||||
|
($ and shares in thousands) |
|
December 31, 2024 |
|
September 30, 2 024 |
|
June 30, 2 024 |
|
March 31, 2 024 |
|
December 31, 2 023 |
|
September 30, 2 023 |
|
June 30, 2 023 |
|
March 31, 2 023 |
|
December 31, 2 022 |
||||||||||||||||||
|
Lending |
|
|
|
|
|
|
|
|
|
|
|
|
|
|
|
|
|
|
||||||||||||||||||
|
Net interest income |
|
$ |
345,210 |
|
|
$ |
316,268 |
|
|
$ |
279,212 |
|
|
$ |
266,536 |
|
$ |
262,626 |
|
$ |
265,215 |
|
|
$ |
231,885 |
|
|
$ |
201,047 |
|
|
$ |
183,607 |
|
||
|
Total noninterest income |
|
|
72,586 |
|
|
|
79,977 |
|
|
|
61,493 |
|
|
|
63,940 |
|
|
|
90,500 |
|
|
|
83,758 |
|
|
|
99,556 |
|
|
|
136,034 |
|
|
|
144,584 |
|
|
Total net revenue |
|
|
417,796 |
|
|
|
396,245 |
|
|
|
340,705 |
|
|
|
330,476 |
|
|
|
353,126 |
|
|
|
348,973 |
|
|
|
331,441 |
|
|
|
337,081 |
|
|
|
328,191 |
|
|
Adjusted net revenue – Lending (1) |
|
|
422,783 |
|
|
|
391,892 |
|
|
|
339,052 |
|
|
|
325,323 |
|
|
|
346,541 |
|
|
|
342,481 |
|
|
|
322,238 |
|
|
|
325,086 |
|
|
|
314,930 |
|
|
Contribution profit – Lending (2) |
|
|
245,958 |
|
|
|
238,928 |
|
|
|
197,938 |
|
|
|
207,719 |
|
|
|
226,110 |
|
|
|
203,956 |
|
|
|
183,309 |
|
|
|
209,898 |
|
|
|
208,799 |
|
|
Technology Platform |
|
|
|
|
|
|
|
|
|
|
|
|
|
|
|
|
|
|
||||||||||||||||||
|
Net interest income |
|
$ |
473 |
|
|
$ |
629 |
|
|
$ |
555 |
|
|
$ |
501 |
|
|
$ |
941 |
|
|
$ |
573 |
|
|
$ |
— |
|
|
$ |
— |
|
|
$ |
— |
|
|
Total noninterest income |
|
|
102,362 |
|
|
|
101,910 |
|
|
|
94,883 |
|
|
|
93,865 |
|
|
|
95,966 |
|
|
|
89,350 |
|
|
|
87,623 |
|
|
|
77,887 |
|
|
|
85,652 |
|
|
Total net revenue (2) |
|
|
102,835 |
|
|
|
102,539 |
|
|
|
95,438 |
|
|
|
94,366 |
|
|
|
96,907 |
|
|
|
89,923 |
|
|
|
87,623 |
|
|
|
77,887 |
|
|
|
85,652 |
|
|
Contribution profit – Technology Platform |
|
|
32,107 |
|
|
|
32,955 |
|
|
|
31,151 |
|
|
|
30,742 |
|
|
|
30,584 |
|
|
|
32,191 |
|
|
|
17,154 |
|
|
|
14,857 |
|
|
|
16,881 |
|
|
Financial Services |
|
|
|
|
|
|
|
|
|
|
|
|
|
|
|
|
|
|
||||||||||||||||||
|
Net interest income |
|
$ |
160,337 |
|
|
$ |
154,143 |
|
|
$ |
139,229 |
|
|
$ |
119,713 |
|
|
$ |
109,072 |
|
|
$ |
93,101 |
|
|
$ |
74,637 |
|
|
$ |
58,037 |
|
|
$ |
45,609 |
|
|
Total noninterest income |
|
|
96,183 |
|
|
|
84,165 |
|
|
|
36,903 |
|
|
|
30,838 |
|
|
|
30,043 |
|
|
|
25,146 |
|
|
|
23,415 |
|
|
|
23,064 |
|
|
|
19,208 |
|
|
Total net revenue |
|
|
256,520 |
|
|
|
238,308 |
|
|
|
176,132 |
|
|
|
150,551 |
|
|
|
139,115 |
|
|
|
118,247 |
|
|
|
98,052 |
|
|
|
81,101 |
|
|
|
64,817 |
|
|
Contribution profit (loss) – Financial Services (2) |
|
|
114,855 |
|
|
|
99,758 |
|
|
|
55,220 |
|
|
|
37,174 |
|
|
|
25,060 |
|
|
|
3,260 |
|
|
|
(4,347 |
) |
|
|
(24,235 |
) |
|
|
(43,588 |
) |
|
Corporate/Other |
|
|
|
|
|
|
|
|
|
|
|
|
|
|
|
|
|
|
||||||||||||||||||
|
Net interest income (expense) |
|
$ |
(35,851 |
) |
|
$ |
(40,030 |
) |
|
$ |
(6,412 |
) |
|
$ |
15,968 |
|
|
$ |
17,002 |
|
|
$ |
(13,926 |
) |
|
$ |
(15,396 |
) |
|
$ |
(23,074 |
) |
|
$ |
(20,632 |
) |
|
Total noninterest income (loss) |
|
|
(7,175 |
) |
|
|
59 |
|
|
|
(7,245 |
) |
|
|
53,634 |
|
|
|
9,254 |
|
|
|
(6,008 |
) |
|
|
(3,702 |
) |
|
|
(837 |
) |
|
|
(1,349 |
) |
|
Total net revenue (loss) (2) |
|
|
(43,026 |
) |
|
|
(39,971 |
) |
|
|
(13,657 |
) |
|
|
69,602 |
|
|
|
26,256 |
|
|
|
(19,934 |
) |
|
|
(19,098 |
) |
|
|
(23,911 |
) |
|
|
(21,981 |
) |
|
Consolidated |
|
|
|
|
|
|
|
|
|
|
|
|
|
|
|
|
|
|
||||||||||||||||||
|
Net interest income |
|
$ |
470,169 |
|
|
$ |
431,010 |
|
|
$ |
412,584 |
|
|
$ |
402,718 |
|
|
$ |
389,641 |
|
|
$ |
344,963 |
|
|
$ |
291,126 |
|
|
$ |
236,010 |
|
|
$ |
208,584 |
|
|
Total noninterest income |
|
|
263,956 |
|
|
|
266,111 |
|
|
|
186,034 |
|
|
|
242,277 |
|
|
|
225,763 |
|
|
|
192,246 |
|
|
|
206,892 |
|
|
|
236,148 |
|
|
|
248,095 |
|
|
Total net revenue |
|
|
734,125 |
|
|
|
697,121 |
|
|
|
598,618 |
|
|
|
644,995 |
|
|
|
615,404 |
|
|
|
537,209 |
|
|
|
498,018 |
|
|
|
472,158 |
|
|
|
456,679 |
|
|
Adjusted net revenue (1) |
|
|
739,112 |
|
|
|
689,445 |
|
|
|
596,965 |
|
|
|
580,648 |
|
|
|
594,245 |
|
|
|
530,717 |
|
|
|
488,815 |
|
|
|
460,163 |
|
|
|
443,418 |
|
|
Net income (loss) |
|
|
332,473 |
|
|
|
60,745 |
|
|
|
17,404 |
|
|
|
88,043 |
|
|
|
47,913 |
|
|
|
(266,684 |
) |
|
|
(47,549 |
) |
|
|
(34,422 |
) |
|
|
(40,006 |
) |
|
Adjusted EBITDA (1) |
|
|
197,957 |
|
|
|
186,237 |
|
|
|
137,901 |
|
|
|
144,385 |
|
|
|
181,204 |
|
|
|
98,025 |
|
|
|
76,819 |
|
|
|
75,689 |
|
|
|
70,060 |
|
|
|
||||||||||||||||||||||||||||||||||||
|
(1) |
|
Adjusted net revenue and adjusted EBITDA are non-GAAP financial measures. For additional information on these measures and reconciliations to the most directly comparable GAAP measures, see "Non-GAAP Financial Measures" and Table 2 to the "Financial Tables" herein. |
|
(2) |
|
Technology Platform segment total net revenue includes intercompany fees. The equal and offsetting intercompany expenses are reflected within all three segments’ directly attributable expenses, as well as within expenses not allocated to segments. The intercompany revenues and expenses are eliminated in consolidation. The revenues are eliminated within Corporate/Other and the expenses represent a reconciling item of segment contribution profit (loss) to consolidated income (loss) before income taxes. |
|
|
|
Table 8 |
|||||||||||||||
|
|
|||||||||||||||
|
Disaggregated Revenue (Unaudited) |
|||||||||||||||
|
|
|||||||||||||||
|
|
Three Months Ended December 31, |
|
Year Ended December 31, |
||||||||||||
|
($ in thousands) |
|
2024 |
|
|
|
2023 |
|
|
|
2024 |
|
|
|
2023 |
|
|
Revenue from contracts with customers |
|
|
|
|
.. |
|
|
||||||||
|
Financial Services |
|
|
|
|
|
|
|
||||||||
|
Referrals, loan platform business |
$ |
16,264 |
|
$ |
9,341 |
|
$ |
52,129 |
|
$ |
33,602 |
||||
|
Referrals, other |
|
2,465 |
|
|
|
1,270 |
|
|
|
8,197 |
|
|
|
4,841 |
|
|
Interchange |
|
21,599 |
|
|
|
13,286 |
|
|
|
66,829 |
|
|
|
35,247 |
|
|
Brokerage |
|
5,849 |
|
|
|
4,940 |
|
|
|
21,494 |
|
|
|
21,127 |
|
|
Other |
|
651 |
|
|
|
417 |
|
|
|
2,797 |
|
|
|
2,647 |
|
|
Total financial services |
$ |
46,828 |
|
|
$ |
29,254 |
|
|
$ |
151,446 |
|
|
$ |
97,464 |
|
|
Technology Platform |
|
|
|
|
|
|
|
||||||||
|
Technology services |
|
86,634 |
|
|
|
85,969 |
|
|
|
346,185 |
|
|
|
319,845 |
|
|
Other |
|
2,045 |
|
|
|
1,112 |
|
|
|
5,492 |
|
|
|
4,145 |
|
|
Total technology platform. |
|
88,679 |
|
|
|
87,081 |
|
|
|
351,677 |
|
|
|
323,990 |
|
|
Total revenue from contracts with customers |
|
135,507 |
|
|
|
116,335 |
|
|
|
503,123 |
|
|
|
421,454 |
|
|
Other sources of revenue |
|
|
|
|
|
|
|
||||||||
|
Loan origination, sales, and securitizations |
|
73,913 |
|
|
|
82,929 |
|
|
|
255,870 |
|
|
|
371,812 |
|
|
Servicing |
|
(1,316 |
) |
|
|
7,525 |
|
|
|
22,244 |
|
|
|
37,328 |
|
|
Loan platform business, other |
|
46,971 |
|
|
|
— |
|
|
|
89,479 |
|
|
|
— |
|
|
Other |
|
8,881 |
|
|
|
18,974 |
|
|
|
87,662 |
|
|
|
30,455 |
|
|
Total other sources of revenue |
$ |
128,449 |
|
|
$ |
109,428 |
|
|
$ |
455,255 |
|
|
$ |
439,595 |
|
|
Total noninterest income |
$ |
263,956 |
|
|
$ |
225,763 |
|
|
$ |
958,378 |
|
|
$ |
861,049 |
|
|
|
|||||||||||||||
|
Table 9 |
||||||||||||||||||||||
|
|
||||||||||||||||||||||
|
Analysis of Charge-Offs (Unaudited) |
||||||||||||||||||||||
|
|
||||||||||||||||||||||
|
|
|
Three Months Ended December 31, 2024 |
|
Three Months Ended December 31, 2023 |
||||||||||||||||||
|
($ in thousands) |
|
Average Loans |
|
Net Charge-offs |
|
Ratio |
|
Average Loans |
|
Net Charge-offs |
|
Ratio |
||||||||||
|
Personal loans |
|
$ |
17,409,608 |
|
$ |
147,595 |
|
3.37 |
% |
|
$ |
15,334,420 |
|
$ |
153,928 |
|
3.98 |
% |
||||
|
Student loans |
|
|
8,214,510 |
|
|
|
12,713 |
|
|
0.62 |
% |
|
|
6,421,994 |
|
|
|
9,616 |
|
|
0.59 |
% |
|
Home loans |
|
|
115,123 |
|
|
|
— |
|
|
— |
% |
|
|
88,562 |
|
|
|
— |
|
|
— |
% |
|
Secured loans |
|
|
902,036 |
|
|
|
— |
|
|
— |
% |
|
|
104,225 |
|
|
|
— |
|
|
— |
% |
|
Credit card |
|
|
277,002 |
|
|
|
8,573 |
|
|
12.31 |
% |
|
|
261,940 |
|
|
|
9,279 |
|
|
14.05 |
% |
|
Commercial and consumer banking |
|
|
150,226 |
|
|
|
39 |
|
|
0.07 |
% |
|
|
114,976 |
|
|
|
41 |
|
|
0.14 |
% |
|
Total loans |
|
$ |
27,068,505 |
|
|
$ |
168,920 |
|
|
2.48 |
% |
|
$ |
22,326,117 |
|
|
$ |
172,864 |
|
|
3.07 |
% |
|
|
|
|
|
|
|
|
|
|
|
|
|
|
||||||||||
|
|
|
Year Ended December 31, 2024 |
|
Year Ended December 31, 2023 |
||||||||||||||||||
|
($ in thousands) |
|
Average Loans |
|
Net Charge-offs |
|
Ratio |
|
Average Loans |
|
Net Charge-offs |
|
Ratio |
||||||||||
|
Personal loans |
|
$ |
16,426,053 |
|
|
$ |
581,370 |
|
|
3.54 |
% |
|
$ |
12,638,807 |
|
|
$ |
432,706 |
|
|
3.42 |
% |
|
Student loans |
|
|
7,414,829 |
|
|
|
47,097 |
|
|
0.64 |
% |
|
|
5,641,787 |
|
|
|
25,048 |
|
|
0.44 |
% |
|
Home loans |
|
|
77,912 |
|
|
|
— |
|
|
— |
% |
|
|
78,554 |
|
|
|
— |
|
|
— |
% |
|
Secured loans |
|
|
1,024,275 |
|
|
|
— |
|
|
— |
% |
|
|
26,291 |
|
|
|
— |
|
|
— |
% |
|
Credit card |
|
|
274,093 |
|
|
|
39,634 |
|
|
14.46 |
% |
|
|
238,832 |
|
|
|
40,992 |
|
|
17.16 |
% |
|
Commercial and consumer banking |
|
|
142,905 |
|
|
|
89 |
|
|
0.06 |
% |
|
|
109,541 |
|
|
|
46 |
|
|
0.04 |
% |
|
Total loans |
|
$ |
25,360,067 |
|
|
$ |
668,190 |
|
|
2.63 |
% |
|
$ |
18,733,812 |
|
|
$ |
498,792 |
|
|
2.66 |
% |
|
|
||||||||||||||||||||||
|
Table 10 |
|||||||||||||||||
|
|
|||||||||||||||||
|
Regulatory Capital (Unaudited) |
|||||||||||||||||
|
|
|||||||||||||||||
|
|
|
December 31, 2024 |
|
December 31, 2023 |
|
|
|||||||||||
|
($ in thousands) |
|
Amount (1) |
|
Ratio (1) |
|
Amount |
|
Ratio |
|
Required Minimum (2) |
|||||||
|
SoFi Technologies |
|
|
|
|
|
|
|
|
|
|
|||||||
|
CET1 risk-based capital |
|
$ |
4,457,212 |
|
16.0 |
% |
|
$ |
3,439,969 |
|
15.0 |
% |
|
7.0 |
% |
||
|
Tier 1 risk-based capital |
|
|
4,457,212 |
|
|
16.0 |
% |
|
|
3,439,969 |
|
|
15.0 |
% |
|
8.5 |
% |
|
Total risk-based capital |
|
|
4,503,619 |
|
|
16.2 |
% |
|
|
3,494,458 |
|
|
15.3 |
% |
|
10.5 |
% |
|
Tier 1 leverage |
|
|
4,457,212 |
|
|
13.4 |
% |
|
|
3,439,969 |
|
|
12.8 |
% |
|
4.0 |
% |
|
Risk-weighted assets |
|
|
27,859,576 |
|
|
|
|
|
22,883,185 |
|
|
|
|
|
|||
|
Quarterly adjusted average assets |
|
|
33,234,725 |
|
|
|
|
|
26,782,318 |
|
|
|
|
|
|||
|
|
|||||||||||||||||
|
(1) |
|
Estimated. |
|
(2) |
|
Required minimums presented for risk-based capital ratios include the required capital conservation buffer. |
View source version on businesswire.com: https://www.businesswire.com/news/home/20250127863954/en/
Contacts
Investors:
SoFi Investor Relations
[email protected]
Media:
SoFi Media Relations
[email protected]