January 16, 2025
If you buy and hold a stock for many years, you'd hope to be making a profit. But more than that, you probably want to see it rise more than the market average. But The Procter & Gamble Company ( NYSE:PG ) has fallen short of that second goal, with a share price rise of 26% over five years, which is below the market return. Over the last twelve months the stock price has risen a very respectable 6.5%.
So let's assess the underlying fundamentals over the last 5 years and see if they've moved in lock-step with shareholder returns.
Check out our latest analysis for Procter & Gamble
While markets are a powerful pricing mechanism, share prices reflect investor sentiment, not just underlying business performance. By comparing earnings per share (EPS) and share price changes over time, we can get a feel for how investor attitudes to a company have morphed over time.
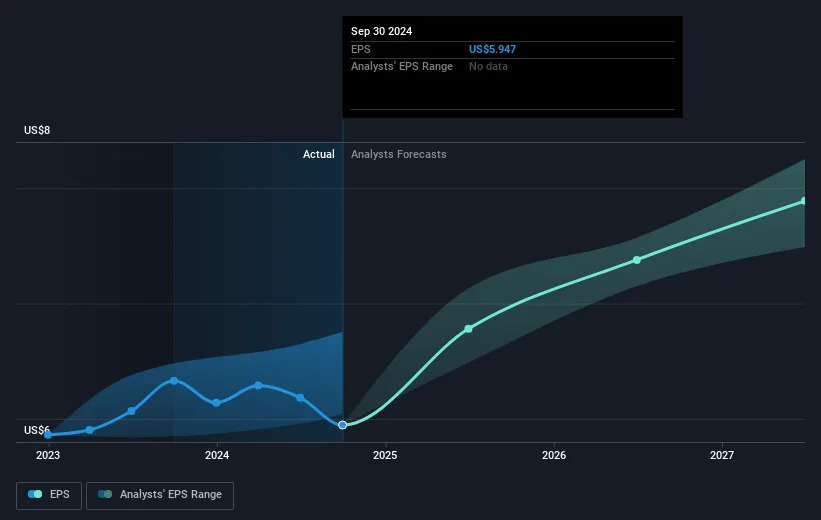
During five years of share price growth, Procter & Gamble achieved compound earnings per share (EPS) growth of 30% per year. This EPS growth is higher than the 5% average annual increase in the share price. Therefore, it seems the market has become relatively pessimistic about the company.
You can see how EPS has changed over time in the image below (click on the chart to see the exact values).
This free interactive report on Procter & Gamble's earnings, revenue and cash flow is a great place to start, if you want to investigate the stock further.
As well as measuring the share price return, investors should also consider the total shareholder return (TSR). Whereas the share price return only reflects the change in the share price, the TSR includes the value of dividends (assuming they were reinvested) and the benefit of any discounted capital raising or spin-off. So for companies that pay a generous dividend, the TSR is often a lot higher than the share price return. In the case of Procter & Gamble, it has a TSR of 43% for the last 5 years. That exceeds its share price return that we previously mentioned. And there's no prize for guessing that the dividend payments largely explain the divergence!
Procter & Gamble provided a TSR of 9.1% over the last twelve months. But that return falls short of the market. The silver lining is that the gain was actually better than the average annual return of 7% per year over five year. This could indicate that the company is winning over new investors, as it pursues its strategy. I find it very interesting to look at share price over the long term as a proxy for business performance. But to truly gain insight, we need to consider other information, too. Consider for instance, the ever-present spectre of investment risk. We've identified 1 warning signwith Procter & Gamble , and understanding them should be part of your investment process.
For those who like to find winning investments this free list of undervalued companies with recent insider purchasing, could be just the ticket.
Please note, the market returns quoted in this article reflect the market weighted average returns of stocks that currently trade on American exchanges.
Have feedback on this article? Concerned about the content?
Get in touch
with us directly.
Alternatively, email editorial-team (at) simplywallst.com.
This article by Simply Wall St is general in nature.
We provide commentary based on historical data and analyst forecasts only using an unbiased methodology and our articles are not intended to be financial advice.
It does not constitute a recommendation to buy or sell any stock, and does not take account of your objectives, or your financial situation. We aim to bring you long-term focused analysis driven by fundamental data. Note that our analysis may not factor in the latest price-sensitive company announcements or qualitative material. Simply Wall St has no position in any stocks mentioned.