January 4, 2025
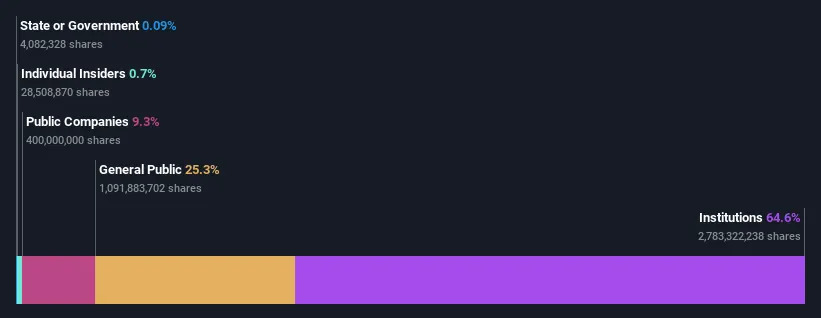
To get a sense of who is truly in control of The Coca-Cola Company ( NYSE:KO ), it is important to understand the ownership structure of the business. With 65% stake, institutions possess the maximum shares in the company. That is, the group stands to benefit the most if the stock rises (or lose the most if there is a downturn).
Since institutional have access to huge amounts of capital, their market moves tend to receive a lot of scrutiny by retail or individual investors. As a result, a sizeable amount of institutional money invested in a firm is generally viewed as a positive attribute.
Let's take a closer look to see what the different types of shareholders can tell us about Coca-Cola.
View our latest analysis for Coca-Cola
Many institutions measure their performance against an index that approximates the local market. So they usually pay more attention to companies that are included in major indices.
We can see that Coca-Cola does have institutional investors; and they hold a good portion of the company's stock. This implies the analysts working for those institutions have looked at the stock and they like it. But just like anyone else, they could be wrong. It is not uncommon to see a big share price drop if two large institutional investors try to sell out of a stock at the same time. So it is worth checking the past earnings trajectory of Coca-Cola, (below). Of course, keep in mind that there are other factors to consider, too.
Since institutional investors own more than half the issued stock, the board will likely have to pay attention to their preferences. Hedge funds don't have many shares in Coca-Cola. Berkshire Hathaway Inc. is currently the largest shareholder, with 9.3% of shares outstanding. The Vanguard Group, Inc. is the second largest shareholder owning 8.7% of common stock, and BlackRock, Inc. holds about 7.4% of the company stock.
On studying our ownership data, we found that 25 of the top shareholders collectively own less than 50% of the share register, implying that no single individual has a majority interest.
While it makes sense to study institutional ownership data for a company, it also makes sense to study analyst sentiments to know which way the wind is blowing. There are plenty of analysts covering the stock, so it might be worth seeing what they are forecasting, too.
While the precise definition of an insider can be subjective, almost everyone considers board members to be insiders. The company management answer to the board and the latter should represent the interests of shareholders. Notably, sometimes top-level managers are on the board themselves.
Most consider insider ownership a positive because it can indicate the board is well aligned with other shareholders. However, on some occasions too much power is concentrated within this group.
Our data suggests that insiders own under 1% of The Coca-Cola Company in their own names. Being so large, we would not expect insiders to own a large proportion of the stock. Collectively, they own US$1.8b of stock. In this sort of situation, it can be more interesting to see if those insiders have been buying or selling.
With a 25% ownership, the general public, mostly comprising of individual investors, have some degree of sway over Coca-Cola. This size of ownership, while considerable, may not be enough to change company policy if the decision is not in sync with other large shareholders.
It appears to us that public companies own 9.3% of Coca-Cola. It's hard to say for sure but this suggests they have entwined business interests. This might be a strategic stake, so it's worth watching this space for changes in ownership.
It's always worth thinking about the different groups who own shares in a company. But to understand Coca-Cola better, we need to consider many other factors. For instance, we've identified 3 warning signs for Coca-Cola(1 shouldn't be ignored) that you should be aware of.
If you are like me, you may want to think about whether this company will grow or shrink. Luckily, you can check this free report showing analyst forecasts for its future .
NB: Figures in this article are calculated using data from the last twelve months, which refer to the 12-month period ending on the last date of the month the financial statement is dated. This may not be consistent with full year annual report figures.
Have feedback on this article? Concerned about the content?
Get in touch
with us directly.
Alternatively, email editorial-team (at) simplywallst.com.
This article by Simply Wall St is general in nature.
We provide commentary based on historical data and analyst forecasts only using an unbiased methodology and our articles are not intended to be financial advice.
It does not constitute a recommendation to buy or sell any stock, and does not take account of your objectives, or your financial situation. We aim to bring you long-term focused analysis driven by fundamental data. Note that our analysis may not factor in the latest price-sensitive company announcements or qualitative material. Simply Wall St has no position in any stocks mentioned.