December 20, 2024
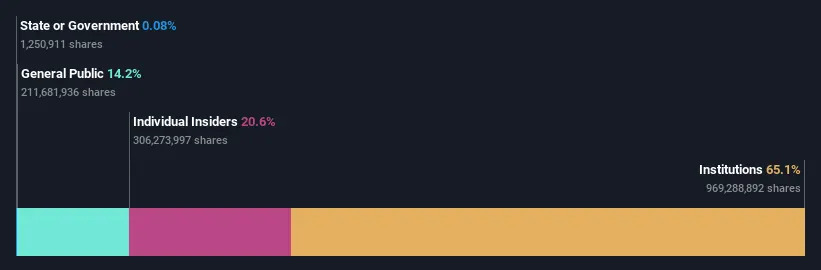
Every investor in NIKE, Inc. ( NYSE:NKE ) should be aware of the most powerful shareholder groups. With 65% stake, institutions possess the maximum shares in the company. That is, the group stands to benefit the most if the stock rises (or lose the most if there is a downturn).
Because institutional owners have a huge pool of resources and liquidity, their investing decisions tend to carry a great deal of weight, especially with individual investors. As a result, a sizeable amount of institutional money invested in a firm is generally viewed as a positive attribute.
In the chart below, we zoom in on the different ownership groups of NIKE.
See our latest analysis for NIKE
Institutional investors commonly compare their own returns to the returns of a commonly followed index. So they generally do consider buying larger companies that are included in the relevant benchmark index.
We can see that NIKE does have institutional investors; and they hold a good portion of the company's stock. This can indicate that the company has a certain degree of credibility in the investment community. However, it is best to be wary of relying on the supposed validation that comes with institutional investors. They too, get it wrong sometimes. If multiple institutions change their view on a stock at the same time, you could see the share price drop fast. It's therefore worth looking at NIKE's earnings history below. Of course, the future is what really matters.
Institutional investors own over 50% of the company, so together than can probably strongly influence board decisions. NIKE is not owned by hedge funds. Our data suggests that Philip Knight, who is also the company's Top Key Executive, holds the most number of shares at 18%. When an insider holds a sizeable amount of a company's stock, investors consider it as a positive sign because it suggests that insiders are willing to have their wealth tied up in the future of the company. Meanwhile, the second and third largest shareholders, hold 7.4% and 6.2%, of the shares outstanding, respectively.
After doing some more digging, we found that the top 14 have the combined ownership of 50% in the company, suggesting that no single shareholder has significant control over the company.
While it makes sense to study institutional ownership data for a company, it also makes sense to study analyst sentiments to know which way the wind is blowing. There are plenty of analysts covering the stock, so it might be worth seeing what they are forecasting, too.
The definition of company insiders can be subjective and does vary between jurisdictions. Our data reflects individual insiders, capturing board members at the very least. The company management answer to the board and the latter should represent the interests of shareholders. Notably, sometimes top-level managers are on the board themselves.
Most consider insider ownership a positive because it can indicate the board is well aligned with other shareholders. However, on some occasions too much power is concentrated within this group.
It seems insiders own a significant proportion of NIKE, Inc.. Insiders own US$24b worth of shares in the US$114b company. That's quite meaningful. It is good to see this level of investment. You can check here to see if those insiders have been buying recently.
With a 14% ownership, the general public, mostly comprising of individual investors, have some degree of sway over NIKE. This size of ownership, while considerable, may not be enough to change company policy if the decision is not in sync with other large shareholders.
I find it very interesting to look at who exactly owns a company. But to truly gain insight, we need to consider other information, too.
I like to dive deeper into how a company has performed in the past. You can access thisinteractive graphof past earnings, revenue and cash flow, for free .
If you are like me, you may want to think about whether this company will grow or shrink. Luckily, you can check this free report showing analyst forecasts for its future .
NB: Figures in this article are calculated using data from the last twelve months, which refer to the 12-month period ending on the last date of the month the financial statement is dated. This may not be consistent with full year annual report figures.
Have feedback on this article? Concerned about the content?
Get in touch
with us directly.
Alternatively, email editorial-team (at) simplywallst.com.
This article by Simply Wall St is general in nature.
We provide commentary based on historical data and analyst forecasts only using an unbiased methodology and our articles are not intended to be financial advice.
It does not constitute a recommendation to buy or sell any stock, and does not take account of your objectives, or your financial situation. We aim to bring you long-term focused analysis driven by fundamental data. Note that our analysis may not factor in the latest price-sensitive company announcements or qualitative material. Simply Wall St has no position in any stocks mentioned.