Darden Restaurants, Inc.
DRI reported second-quarter fiscal 2025 results, with earnings missing the Zacks Consensus Estimate and revenues beating the same. The top and bottom lines increased on a year-over-year basis.
Stay up-to-date with all quarterly releases: See Zacks Earnings Calendar.
During the fiscal second quarter, Darden reported adjusted earnings per share (EPS) of $2.03, missing the Zacks Consensus Estimate of $2.05. In the prior-year quarter, DRI reported an adjusted EPS of $1.84.
Total sales during the quarter came in at $2.89 billion, beating the consensus mark of $2.87 billion. Sales inched up 6% from the prior-year quarter’s level. The upside was backed by a blended same-restaurant sales increase of 2.4%. Also, contributions from 103 Chuy's restaurants and 39 net new restaurants added to the positives.
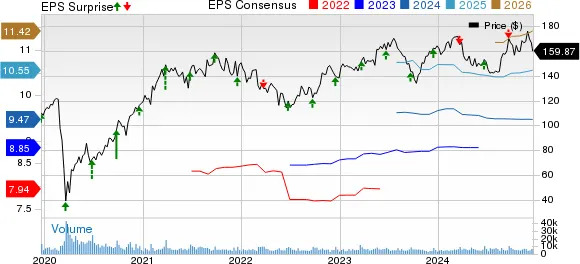
Darden Restaurants, Inc. price-consensus-eps-surprise-chart | Darden Restaurants, Inc. Quote
Darden reports business under four segments — Olive Garden, LongHorn Steakhouse, Fine Dining, including The Capital Grille and Eddie V's and Other Business.
During the fiscal second quarter, sales at Olive Garden increased 3.3% year over year to $1.29 billion. Our estimate for the metric was $1.3 billion. Comps in the segment increased 2% year over year against a 2.9% fall reported in the previous quarter.
At LongHorn Steakhouse, sales were up 10.4% year over year to $710.1 million. Our estimate for the metric was $687.4 million. Comps in the segment rose 7.5% year over year compared with the 3.7% growth reported in the previous quarter.
Sales in Fine Dining fell 3.8% year over year to $306 million. Our estimate for the metric was $328.3 million. Comps in the segment fell 5.8% year over year compared with a 6% drop reported in the previous quarter.
Sales in Other Business increased 12.9% year over year to $581.4 million. Our estimate for the metric was $527.6 million. Comps in the Other Business inched up 0.7% year over year against a 1.8% fall reported in the previous quarter.
In the fiscal second quarter, total operating costs and expenses inched up 6.1% year over year to $2.6 billion. The upside was primarily due to increased restaurant expenses, labor costs and marketing expenses. The figure compares to our projection of $2.53 billion.
As of Nov. 24, 2024, cash and cash equivalents came in at $217.3 million compared with $194.8 million as of May 26.
During the fiscal second quarter, inventories came in at $318 million compared with $297.7 million reported in the previous quarter. As of Nov. 24, 2024, long-term debt was $2.12 billion compared with $1.37 million as of May 26.
During the fiscal second quarter, Darden’s board of directors repurchased approximately 0.9 million shares of its common stock, worth approximately $142 million. As of the fiscal second quarter, the company stated availability of approximately $601 million under the $1 billion repurchase authorization.
For the fiscal 2025, the company expects total sales to be approximately $12.1 billion. Same-restaurant sales growth in the fiscal 2025 is anticipated to be 1.5% year over year. Diluted EPS from continuing operations is anticipated in the band of $9.40-$9.60.
The company expects to open 50-55 net new restaurants and projects a total capital spending of approximately $650 million in fiscal 2025.
Darden currently carries a Zacks Rank #3 (Hold).
Some better-ranked stocks in the Zacks Retail-Wholesale sector have been discussed below.
Deckers Outdoor Corporation
DECK currently sports a Zacks Rank #1 (Strong Buy). You can see
the complete list of today’s Zacks Rank #1 stocks here.
DECK has a trailing four-quarter earnings surprise of 41.1%, on average. The stock has gained 19.7% in the past six months. The Zacks Consensus Estimate for DECK’s fiscal 2025 sales and EPS indicates growth of 13.6% and 12.8%, respectively, from the year-ago period’s levels.
Brinker International, Inc.
EAT presently flaunts a Zacks Rank of 1. EAT has a trailing four-quarter earnings surprise of 12.1%, on average. The stock has surged 87.1% in the past six months.
The consensus estimate for EAT’s fiscal 2025 sales and EPS indicates growth of 8.4% and 37.6%, respectively, from the year-ago period’s levels.
Sprouts Farmers Market, Inc.
SFM currently sports a Zacks Rank of 1. SFM has a trailing four-quarter earnings surprise of 15.3%, on average. The stock has risen 73.9% in the past six months.
The Zacks Consensus Estimate for SFM’s 2025 sales and EPS indicates a rise of 10% and 14.4%, respectively, from the year-ago period’s levels.
Want the latest recommendations from Zacks Investment Research? Today, you can download 7 Best Stocks for the Next 30 Days. Click to get this free report
Darden Restaurants, Inc. (DRI) : Free Stock Analysis Report
Brinker International, Inc. (EAT) : Free Stock Analysis Report
Deckers Outdoor Corporation (DECK) : Free Stock Analysis Report
Sprouts Farmers Market, Inc. (SFM) : Free Stock Analysis Report
To read this article on Zacks.com click here.
Zacks Investment Research